AlgoWay Blog
Guides, manuals and platform references.
Core
- All articles
- FAQ
- PineConnector alternative
- TradersPost alternative
- Automate TradingView alerts
- Automate Telegram signals
- AlgoWay CopyTrader
- cTrader Copier
- TrendSpider with AlgoWay
- How to Automate a TradingView Indicator with Dynamic SL/TP and 1% Risk on MT5
JSON & Alerts
- JSON schema
- Manual alerts
- TradingView without paid subscription
- AlgoWay Strategy Integration in Pine Script
- Python Trading Bot Webhook Integration
- TRALADAL - TradingView Alert Adapter
- TradingView Order Action Alert
- How to use Clone Mode
MT5 / Expert Advisors
Errors
Integrations
- MetaTrader 5
- Tradovate
- TradeLocker
- cTrader
- Match-Trader
- DXtrade
- Capital.Com
- Binance
- Bybit
- MEXC
- OKX
- Bitget
- Hyperliquid
- BingX
- Alpaca
- Interactive Brokers
- Gate.io
- Coinbase
- TooBit
- WEEX
- ProjectX
- Rithmic
Other Publications
- MT5 EA Webhook JSON Reference
- OANDA MT5 with AlgoWay
- Buy Webhook via Buy Me a Coffee
- AlgoWay vs PineConnector
- Compare AlgoWay with other trading automation tools
- AlgoWay Red News Filter
- Why Paid Trading Indicators Avoid Verifiable Backtests
- How Trade Automation Tools Mislead You
- utomating a Prop-Firm Eval End to End:
- ATP Premium Indicator Testing Bot
- Why TradingView Backtests Win but Live Trades Lose
- Best Prop Firms for Trading Automation and Telegram Signal Copy in 2026
- Four AIs, One Trader, and the Strange Case of TradingView to Alpaca
- TradingView Automation
AlgoWay Strategy Lab
TradingView Strategy Wins in Backtests but Loses Live: What to Check First
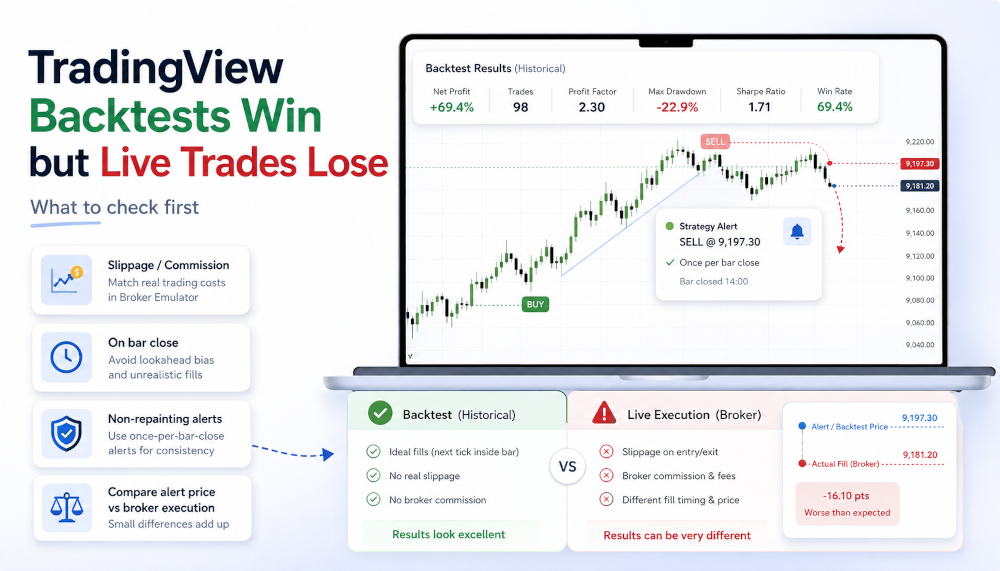
A strategy can show a 90% win rate in TradingView and still lose money when its alerts are executed on TradeLocker, MetaTrader 5 or another live platform. That does not automatically mean the webhook, broker connection or execution platform is broken. Backtests and live trading operate under different conditions, and even a small mismatch can completely change the result of a strategy that depends on precise entries.
The fastest way to diagnose the problem is to stop looking at the final win rate and compare the trading process itself: strategy assumptions, exact alert timestamps, historical signal positions, the price sent by TradingView and the price actually filled by the broker.
Last updated: 2026-08-26 • Author: AlgoWay
Quick Answer
If TradingView reports excellent historical performance while live execution performs badly, check these four things before changing the strategy:
- Does the Strategy Tester include realistic slippage and commissions?
- Does the strategy repaint or move historical signals after the alert has already fired?
- Is the strategy intended to execute only on confirmed bar close?
- How different are TradingView's signal price and the broker's real executable price, including spread?
A webhook can be delivered perfectly and still reproduce a strategy badly if the strategy's backtest assumptions do not match the market conditions of the live account.
1. Add Realistic Slippage and Commissions to the TradingView Strategy
The first check is inside TradingView's strategy properties. A backtest with zero commission and zero slippage is usually too optimistic. Every live market order pays something through spread, commission, slippage or a combination of all three.
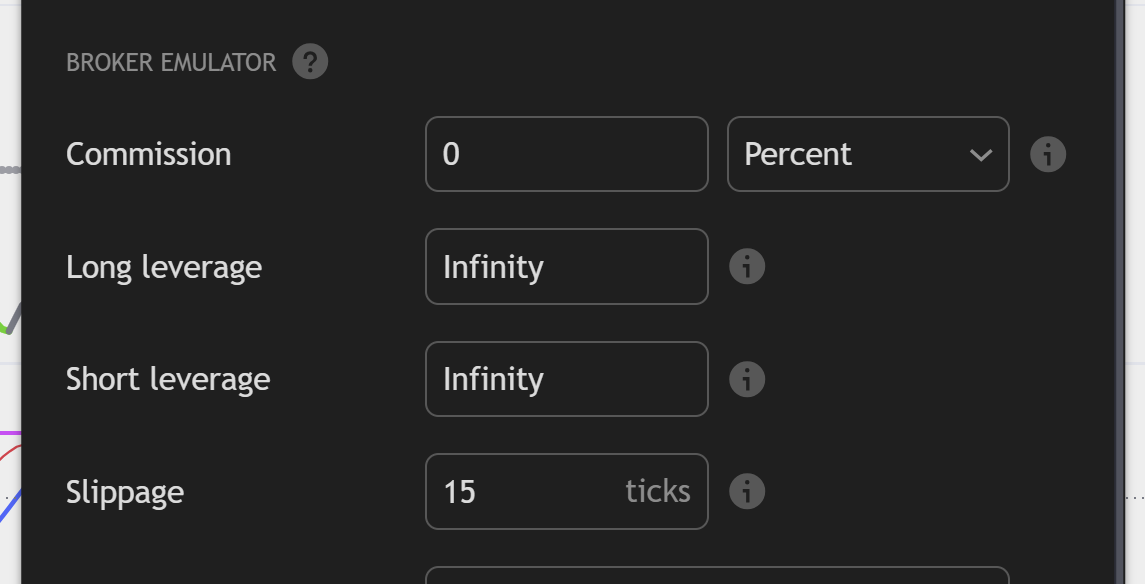
For forex, CFDs and index trading, a useful first stress test is to add approximately 15-20 ticks of slippage and then compare the Strategy Tester again. The exact value must match the instrument and broker conditions rather than being treated as a universal number.
For crypto strategies, commission is often more important than a fixed tick value. If the real exchange route is roughly around 0.08% per transaction, use that as a realistic test input rather than leaving commission at zero. The correct value is always the fee actually charged by the exchange and account tier.
Also review the leverage assumptions if position sizing depends on available margin. An unlimited leverage setting can make the backtest accept positions that would not behave the same way on the real account.
2. Check Whether the Strategy Repaints
This is one of the most important checks and one of the easiest to miss. A repainting strategy can show a historical entry at a clean location after the market has already moved, while the live alert originally fired at another time or may have fired on a signal that later disappeared from the chart.
The user should compare the exact TradingView alert timestamp down to the second with the trade or signal shown on the chart and in the Strategy Tester trade list. Do not compare only the date or candle. Compare the actual alert event.
If an alert fired at 10:42:17, but after refreshing or reopening the chart the strategy now shows the entry on another bar, another time or no entry at all, the historical chart is not reproducing what the live alert actually saw. That is a strategy problem, not an execution-platform problem.
TradingView's alert log is especially valuable here because a historical strategy recalculation can change what is drawn on the chart, while the alert that was already triggered remains evidence of what happened in real time.
If the script reads another timeframe, check higher-timeframe confirmation separately from chart-bar close. A finished five-minute candle can still contain an unfinished hourly input.
3. Check the Strategy Execution Mode: On Bar Close
If the strategy is designed around confirmed candles, use On bar close execution. Otherwise a condition can appear temporarily inside the candle, trigger an alert, and then disappear before the bar closes.
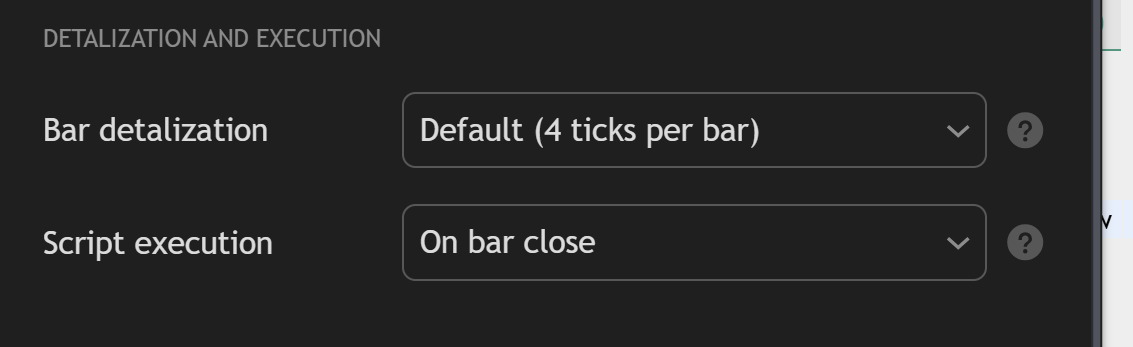
This matters because the historical Strategy Tester usually looks much cleaner when you inspect completed candles. Live markets do not wait politely for the candle to finish unless the strategy is explicitly configured that way.
For strategies intentionally designed to trade intrabar, this setting should not be forced. In that case the developer has to make sure the historical test reproduces intrabar behavior correctly. But for a normal confirmed-bar strategy, On bar close removes a large source of random live signals.
4. Compare TradingView Price With the Real Broker Fill
After the strategy itself passes the first checks, move to the execution platform. It does not matter whether the destination is TradeLocker, MetaTrader 5 or another broker platform. The comparison is the same.
Take one real trade and compare:
- the exact TradingView alert time;
- the TradingView price included in the alert or visible at that moment;
- the broker's bid and ask around that time;
- the actual filled entry price;
- the spread and additional slippage between the signal and the fill.
The screenshot below shows the kind of evidence that matters: the alert has an exact trigger time, an alert payload and a TradingView price. That can be compared directly with the corresponding broker-side order.
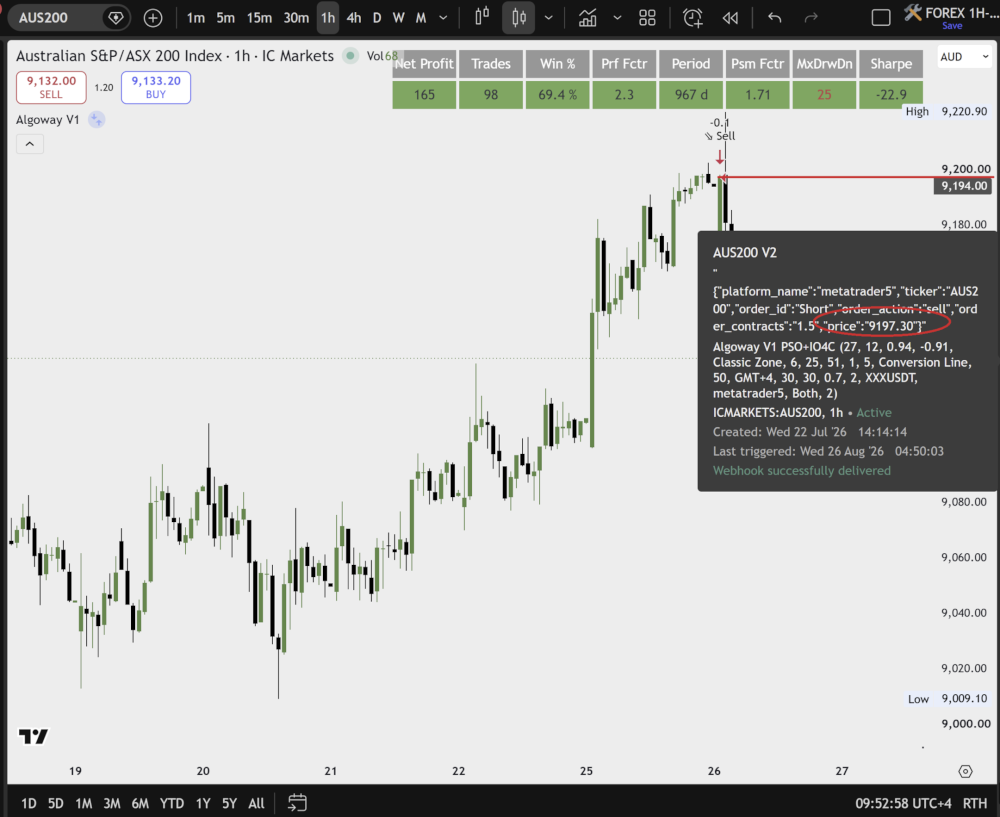
Remember that the TradingView chart price is not automatically the same thing as the executable broker price. Different data feeds can have different quotes, and live orders execute against bid or ask rather than a theoretical chart line.
5. Why This Becomes Critical on Low Timeframes
A difference of a few ticks may be irrelevant to a swing strategy that targets a large move. The same difference can destroy a one-minute or five-minute strategy whose average profit per trade is small.
Suppose the backtest expects a small profit after entering near the candle close. In live trading the order may arrive after network delay, cross the spread and receive a slightly worse fill. If the average expected edge is only a few ticks, those normal execution costs can consume most of it before the trade even starts.
This is why an impressive win rate is not enough. A strategy with many tiny winners can be more fragile than a strategy with a lower win rate but much larger average profit relative to spread, commission and slippage.
6. How to Audit One Trade Correctly
Do not start by comparing 100 trades. Pick one clearly identifiable trade and reconstruct it from beginning to end.
| Check | TradingView | Live platform |
|---|---|---|
| Signal time | Exact alert timestamp | Order creation / fill timestamp |
| Direction | BUY or SELL from alert | Executed side |
| Price | Alert or strategy price | Actual filled price |
| Historical signal | Chart and Strategy Tester after refresh | Not applicable |
| Trading cost | Configured commission/slippage | Real spread, commission and slippage |
If the alert time does not match the historical strategy signal, investigate repainting or intrabar logic. If the alert is correct but the broker fill is materially worse, investigate spread, quote differences and execution. If both match closely but the Strategy Tester still reports a very different result, the backtest assumptions themselves need to be reviewed.
Final Checklist
When a TradingView strategy wins in the Strategy Tester but loses after automation, check the chain in order: realistic commission and slippage, repainting, exact alert timestamps, bar-close behavior, broker spread and actual fill price.
The goal is not to make the backtest look worse. The goal is to make the backtest behave more like the market where the strategy will actually trade. Once the Strategy Tester and the live execution assumptions are close, the difference between historical and real results becomes much easier to understand.
Related AlgoWay Guides
- How to create TradingView webhook alerts for AlgoWay
- Automate TradingView alerts to brokers and trading platforms
- AlgoWay JSON schema guide
When the strategy is also tested in MetaTrader 5, compare MT5 real ticks and generated ticks separately. The intraminute path and spread assumptions can change the first differing trade.