AlgoWay Blog
Guides, manuals and platform references.
Core
- All articles
- FAQ
- PineConnector alternative
- TradersPost alternative
- Automate TradingView alerts
- Automate Telegram signals
- AlgoWay CopyTrader
- cTrader Copier
- TrendSpider with AlgoWay
- How to Automate a TradingView Indicator with Dynamic SL/TP and 1% Risk on MT5
JSON & Alerts
- JSON schema
- Manual alerts
- TradingView without paid subscription
- AlgoWay Strategy Integration in Pine Script
- Python Trading Bot Webhook Integration
- TRALADAL - TradingView Alert Adapter
- TradingView Order Action Alert
- How to use Clone Mode
MT5 / Expert Advisors
Errors
Integrations
- MetaTrader 5
- Tradovate
- TradeLocker
- cTrader
- Match-Trader
- DXtrade
- Capital.Com
- Binance
- Bybit
- MEXC
- OKX
- Bitget
- Hyperliquid
- BingX
- Alpaca
- Interactive Brokers
- Gate.io
- Coinbase
- TooBit
- WEEX
- KuCoin
- Kraken
- ProjectX
- Rithmic
Other Publications
- MT5 EA Webhook JSON Reference
- OANDA MT5 with AlgoWay
- Buy Webhook via Buy Me a Coffee
- AlgoWay vs PineConnector
- Compare AlgoWay with other trading automation tools
- AlgoWay Red News Filter
- Why Paid Trading Indicators Avoid Verifiable Backtests
- How Trade Automation Tools Mislead You
- utomating a Prop-Firm Eval End to End:
- ATP Premium Indicator Testing Bot
- Why TradingView Backtests Win but Live Trades Lose
- Best Prop Firms for Trading Automation and Telegram Signal Copy in 2026
- Four AIs, One Trader, and the Strange Case of TradingView to Alpaca
- TradingView Automation
AlgoWay Strategy Lab
High Profit Factor: Why a Small Trade Sample Misleads
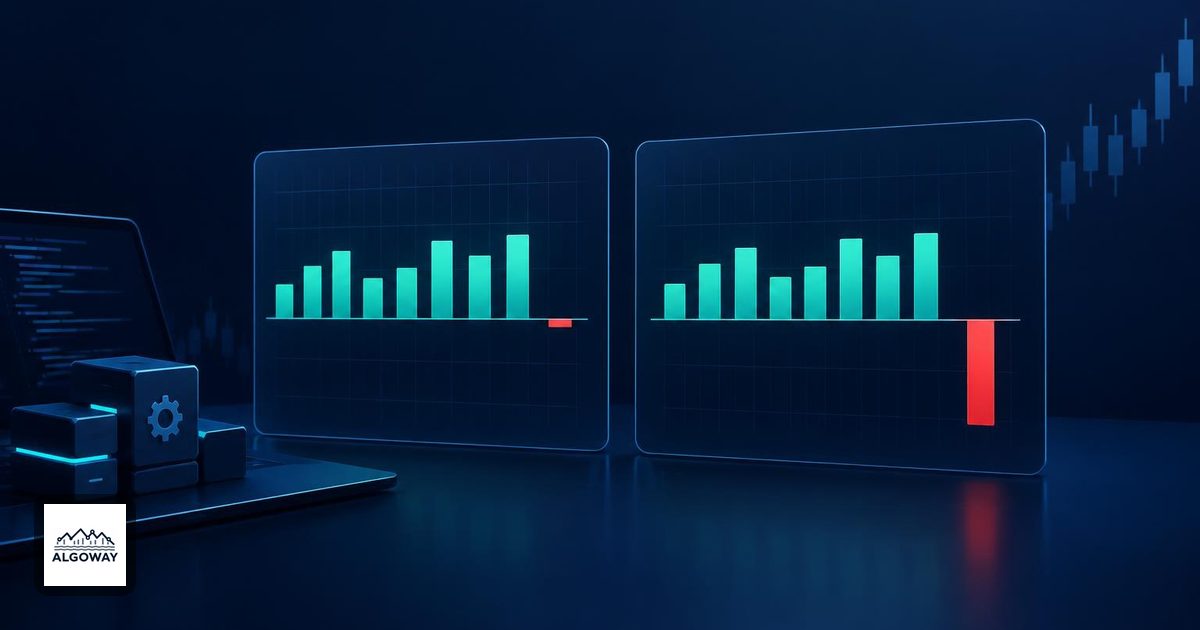
A profit factor of 9 can come from nine $100 winners and one $100 loser. Add a single $800 loss and the factor falls to 1. Nothing about the earlier trades changed. The denominator finally had something substantial to say.
That matters when a backtest is being used to justify automated trading. Before connecting a strategy's alerts to an AlgoWay workflow, inspect the trades behind the ratio and compare the same rules across separate observations. The TradingView backtesting and AlgoWay trade-metrics guide provides context for comparing simulated results with execution records. A headline metric cannot establish that the next alert is worth trading.
What profit factor actually divides
Profit factor is the sum of realized winning amounts divided by the absolute sum of realized losing amounts. For example, $900 of wins divided by $100 of losses gives 9. On that ledger, a value above 1 means wins exceed losses; a value below 1 means losses exceed wins. It does not mean a factor of 9 predicts a ninefold account return. TradingView's profit-factor definition also excludes unrealized results from open positions.
The ratio contains no explicit trade-count term. Two reports can have the same factor even if one has ten trades and the other has a thousand. Nor does the ratio reveal the order of the trades. Rearranging a fixed list of trade outcomes preserves the sums while changing the path through gains and losses. That is why drawdown and recovery deserve their own inspection.
Give the denominator one more loss
The following is an invented ledger for arithmetic, not a backtest, forecast or account result. Each row adds one hypothetical losing trade to the same original record of nine $100 wins and one $100 loss. Rows are alternatives, not a sequence.
| Additional loss | Total winning amount | Total losing amount | Profit factor | Net result |
|---|---|---|---|---|
| None | $900 | $100 | 9.00 | +$800 |
| $100 | $900 | $200 | 4.50 | +$700 |
| $400 | $900 | $500 | 1.80 | +$400 |
| $800 | $900 | $900 | 1.00 | $0 |
| $1,000 | $900 | $1,100 | 0.82 | -$200 |
For winning sum W, current losing sum L and an additional loss x, the new ratio is W / (L + x). This is a sensitivity check. It does not assign any probability to that extra loss. Choose scenarios relevant to the strategy's position sizes and exit rules, and label them as scenarios.
If there are no losing trades, the denominator is zero. There is no finite quotient to interpret as a stable estimate. Whatever symbol a report displays, the sample has not measured how the strategy behaves when losses occur. With no wins and no losses, the calculation is undefined as well. A blank denominator is missing evidence, not an insurance policy.
Look for concentration on both sides
A tiny losing sum is one explanation for a large factor. A single exceptional winner is another. Suppose four $25 wins and one $800 win sit against $100 of losses. The factor is again 9. Remove the $800 winner in a sensitivity calculation and the remaining ratio becomes 1.
Do not quietly delete that winner from the actual report. Keep the complete ledger, then show the alternative alongside it. The point is to expose dependence on one outcome. Trend-following rules may deliberately seek occasional large winners; concentration needs explanation, not automatic rejection.
Count losing trades separately from total trades, inspect the largest win and loss, and divide the record into meaningful time periods. Many entries during one market move need not represent many different conditions. There is no universal trade count or profit-factor cutoff in this calculation that certifies a strategy for deployment.
Use a consistent cost basis
For an exported ledger, first decide which fees are already included in each trade's result. Sum positive results and the absolute negative results after applying that consistent treatment. A small before-fee winner may become a loser after fees, changing both sides of the ratio.
Do not assume that “gross” means commissions are excluded in every report. TradingView documents its gross profit as the sum of positive Net PnL entries, with configured commission deducted before summation. Its gross loss documentation similarly includes configured commission in losing trades. See the official gross-profit and gross-loss definitions. Subtracting the same commission again would double-count it.
Our expectancy and trading-cost guide explains the related per-trade arithmetic. Profit factor summarizes the winning and losing totals; expectancy expresses the average outcome per trade. Neither removes uncertainty about future fills or market conditions.
What to retain before automating
Save the strategy version, inputs, test dates, cost assumptions and complete trade ledger with the metric. Review open-position exposure separately, because realized profit factor leaves it out. Then evaluate the unchanged rules on a separate period or forward observations and reconcile any difference in trades or costs before comparing the ratios.
A useful report says more than “profit factor 9.” It says how many winners and losers produced it, which trades dominate it, what costs it includes, and how sharply the conclusion changes under a clearly labeled loss scenario. Those details are less impressive on a banner and much more useful beside an automation switch.