AlgoWay Blog
Guides, manuals and platform references.
Core
- All articles
- FAQ
- PineConnector alternative
- TradersPost alternative
- Automate TradingView alerts
- Automate Telegram signals
- AlgoWay CopyTrader
- cTrader Copier
- TrendSpider with AlgoWay
- How to Automate a TradingView Indicator with Dynamic SL/TP and 1% Risk on MT5
JSON & Alerts
- JSON schema
- Manual alerts
- TradingView without paid subscription
- AlgoWay Strategy Integration in Pine Script
- Python Trading Bot Webhook Integration
- TRALADAL - TradingView Alert Adapter
- TradingView Order Action Alert
- How to use Clone Mode
MT5 / Expert Advisors
Errors
Integrations
- MetaTrader 5
- Tradovate
- TradeLocker
- cTrader
- Match-Trader
- DXtrade
- Capital.Com
- Binance
- Bybit
- MEXC
- OKX
- Bitget
- Hyperliquid
- BingX
- Alpaca
- Interactive Brokers
- Gate.io
- Coinbase
- TooBit
- WEEX
- ProjectX
- Rithmic
Other Publications
- MT5 EA Webhook JSON Reference
- OANDA MT5 with AlgoWay
- Buy Webhook via Buy Me a Coffee
- AlgoWay vs PineConnector
- Compare AlgoWay with other trading automation tools
- AlgoWay Red News Filter
- Why Paid Trading Indicators Avoid Verifiable Backtests
- How Trade Automation Tools Mislead You
- utomating a Prop-Firm Eval End to End:
- ATP Premium Indicator Testing Bot
- Why TradingView Backtests Win but Live Trades Lose
- Best Prop Firms for Trading Automation and Telegram Signal Copy in 2026
- Four AIs, One Trader, and the Strange Case of TradingView to Alpaca
- TradingView Automation
AlgoWay Strategy Lab
Trading Drawdown Recovery: Why a 20% Loss Needs 25%
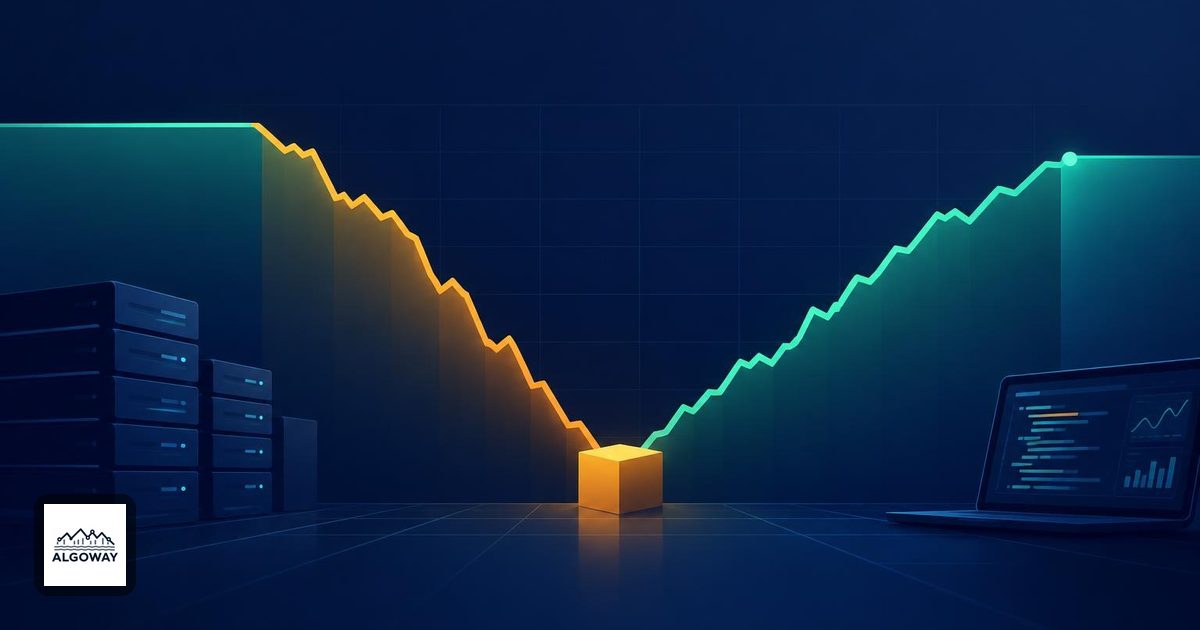
An account falls from $12,000 to $9,600. It has lost 20%. A subsequent 20% gain produces $11,520, still $480 short of the old high. The dollars have not disappeared into a statistical loophole. The second percentage simply starts from a smaller amount.
After a drawdown of d, expressed as a decimal, the gain needed to recover is d / (1 − d). A 20% loss therefore needs a 25% gain. This is recovery arithmetic, not a forecast that recovery will happen.
For automated trading, the practical question is what your next order risks against the capital that remains. When reviewing an AlgoWay workflow, pair this calculation with the TradingView-to-MT5 risk-percent sizing guide and verify the sizing basis you actually configured. A recovery target is not an instruction to enlarge the next trade.
Start with the peak, then change the denominator
Let P be a previous account peak and E the current account value, using the same measurement basis and assuming no deposits or withdrawals between them:
- Drawdown = (P − E) / P
- Required recovery gain = (P − E) / E
Multiply either result by 100 to express it as a percentage. With P = $12,000 and E = $9,600, the shortfall is $2,400. Dividing by the old peak gives 20%; dividing by today's smaller account gives 25%. CME's risk-control lesson explains the same loss-and-recovery asymmetry.
| Loss from peak | Amount left from $12,000 | Gain needed to regain $12,000 |
|---|---|---|
| 5% | $11,400 | 5.26% |
| 15% | $10,200 | 17.65% |
| 20% | $9,600 | 25.00% |
| 35% | $7,800 | 53.85% |
| 50% | $6,000 | 100.00% |
| 75% | $3,000 | 300.00% |
These are calculated illustrations, rounded to two decimal places, with no intervening cash flows. At a complete loss of capital, the formula divides by zero: a percentage return on zero capital cannot restore the account. It requires new capital or some other source of funds.
Current drawdown is not maximum drawdown
Imagine the following sequence of account values: $12,000, $10,200, $11,400. The current shortfall from the peak is 5%. The deepest observed shortfall in that sequence was 15%. Recovering to $11,400 improves the current reading but does not erase the earlier maximum drawdown.
Measurement frequency matters as well. A daily or monthly snapshot can miss a deeper dip between observations. CME's discussion of drawdown depth and recovery explicitly distinguishes monthly observations from more detailed daily information. Record the sampling interval before comparing two reports.
Use a consistent account-value series. If one number includes unrealized losses while another counts only closed trades, the comparison answers a different question. A position can be deeply underwater before it closes; omitting that interval makes it invisible to a closed-trade-only record.
The same dollar risk becomes a larger percentage
Suppose your original plan risked $120 per trade on a $12,000 account, or 1%. At $9,600, continuing to risk $120 means risking 1.25% of the remaining account. Recalculating 1% of current capital instead gives $96. Neither the market nor the order ticket knows which denominator you intended.
A fixed-dollar plan and a fixed-percentage plan therefore produce different paths. To make the distinction concrete, assume five consecutive losses, each exactly equal to the planned risk, with no extra costs or slippage:
- Five fixed $120 losses leave $11,400, a 5% decline.
- Five losses of 1% of the shrinking account leave $12,000 × 0.995 = $11,411.88, a 4.90% decline.
The second path reduces the dollars at risk after each loss. That is an arithmetic consequence of the sizing rule, not evidence that the trading strategy has an edge. Actual fills, costs and order-size constraints can make realized losses differ from the planned amount. Keep those execution effects separate when reviewing the record.
Do not turn a recovery percentage into a deadline
The 25% required after a 20% drawdown tells you the distance to the old peak. It does not tell you how many trades it will take, what the next trade will earn, or what position size is safe. Raising size merely because the account is behind changes the future risk; it does not improve the underlying entry rule.
Even a strategy with positive average expectancy can have losing stretches. Conversely, a quick recovery in one sequence does not establish positive expectancy. Review the win-rate, payoff and trading-cost calculation alongside the account path. They answer different questions: what the average trade earned, and how far the account fell while producing that average.
Keep a recovery record that can be checked
A useful record contains the dated peak, the current value on the same basis, the lowest observed value since the peak, deposits or withdrawals, and the dollars planned at risk on the next trade. Reconcile cash flows before calling a change a trading gain. Adding $2,400 to a $9,600 account restores the displayed $12,000 balance, but it is a deposit, not a 25% trading return.
Measure recovery in net account value when the original peak was measured that way. If costs still have to be deducted, a gross-profit figure that reaches the target has not yet restored the same amount of capital. For an automated workflow, keep that account record beside the signal and execution records, rather than treating a strategy chart as the account statement.
The old peak is a useful reference point. It is a poor trading signal. Let it describe the amount still missing, while tested entry rules and an explicit sizing policy determine what happens next.