AlgoWay Blog
Guides, manuals and platform references.
Core
- All articles
- FAQ
- PineConnector alternative
- TradersPost alternative
- Automate TradingView alerts
- Automate Telegram signals
- AlgoWay CopyTrader
- cTrader Copier
- TrendSpider with AlgoWay
- How to Automate a TradingView Indicator with Dynamic SL/TP and 1% Risk on MT5
JSON & Alerts
- JSON schema
- Manual alerts
- TradingView without paid subscription
- AlgoWay Strategy Integration in Pine Script
- Python Trading Bot Webhook Integration
- TRALADAL - TradingView Alert Adapter
- TradingView Order Action Alert
MT5 / Expert Advisors
Errors
Integrations
- MetaTrader 5
- Tradovate
- TradeLocker
- Match-Trader
- DXtrade
- Capital.Com
- Binance
- Bybit
- MEXC
- OKX
- Bitget
- Hyperliquid
- BingX
- Alpaca
- Interactive Brokers
- Gate.io
- Coinbase
- TooBit
- WEEX
- ProjectX
- cTrader logic
Other Publications
- MT5 EA Webhook JSON Reference
- OANDA MT5 with AlgoWay
- Buy Webhook via Buy Me a Coffee
- AlgoWay vs PineConnector
- Compare AlgoWay with other trading automation tools
- AlgoWay Red News Filter
- Why Paid Trading Indicators Avoid Verifiable Backtests
- How Trade Automation Tools Mislead You
- utomating a Prop-Firm Eval End to End:
- ATP Premium Indicator Testing Bot
- Why TradingView Backtests Win but Live Trades Lose
- Best Prop Firms for Trading Automation and Telegram Signal Copy in 2026
- Four AIs, One Trader, and the Strange Case of TradingView to Alpaca
- TradingView Automation
AlgoWay Strategy Lab
Supertrend Settings: ATR Length and Multiplier Guide
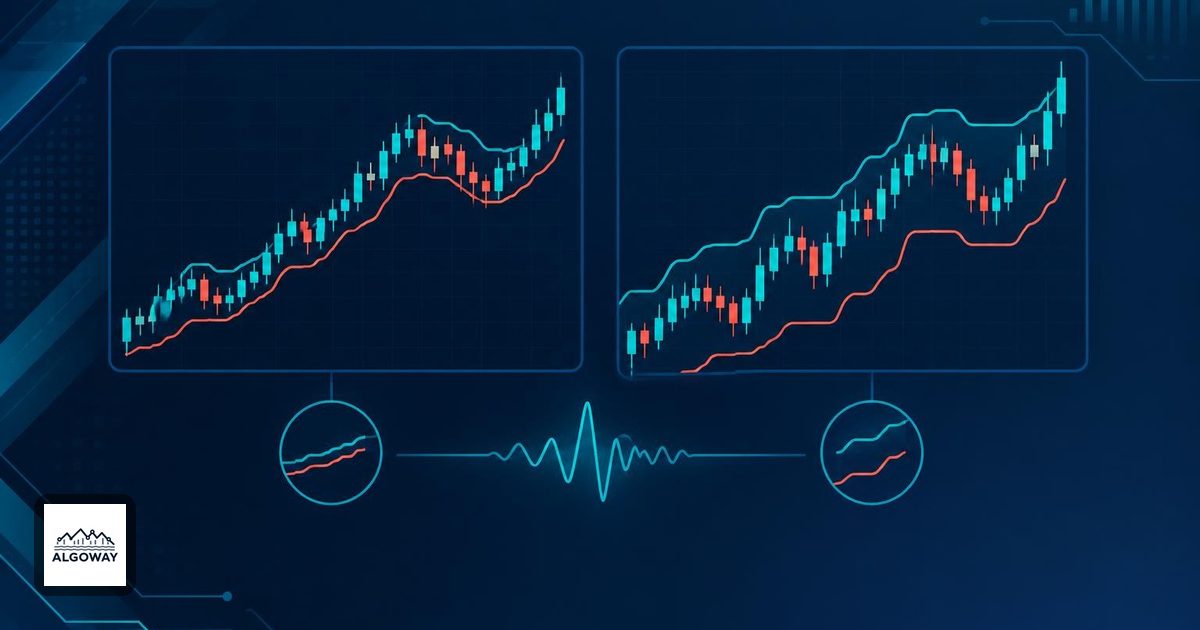
Two Supertrend charts can disagree without either being broken. Change the ATR length or multiplier and you change the calculation behind the line. Change both at once and it becomes harder to tell which adjustment caused the next reversal.
ATR length controls the volatility estimate; the multiplier scales the distance used to build the bands. Neither setting is a promise of better trades. Here is how to compare them without mistaking a quieter chart for a stronger strategy.
One setting measures volatility; the other scales it
Average True Range measures movement, not bullishness. Its starting point, true range, is the largest of the bar's high-low distance and the absolute distances from the previous close to the current high and low. This lets it account for gaps. TradingView's ATR documentation describes RMA as its default smoothing. See the official ATR explanation.
A shorter smoothing length gives recent changes more influence. A longer one smooths them more slowly. That does not mean a longer length always produces a larger ATR: after a volatility jump it can lag below the shorter estimate; after activity fades it can remain above it. Length is measured in bars of the selected timeframe, so 10 bars on a five-minute chart and 10 daily bars describe very different observations.
Supertrend starts with the midpoint of each bar's high and low. Its fresh upper and lower bands sit one multiplier-times-ATR distance above and below that midpoint. Increasing the multiplier widens these fresh bands when the midpoint and ATR are held fixed. The plotted line also depends on previous bands and closes; it is not simply a fresh midpoint-minus-ATR calculation on every bar. TradingView documents the band carry-forward and direction rules.
A small calculation makes the distinction visible
Suppose a bar has a high of 102, a low of 98 and an ATR of 2. Its midpoint is 100. These are hypothetical values for arithmetic, not measured trading results.
- With multiplier 2, the fresh bands are 104 and 96.
- With multiplier 3, the fresh bands are 106 and 94.
- If a different ATR length instead produces an ATR of 1.5, multiplier 3 gives fresh bands of 104.5 and 95.5.
The third case matters: changing the length changed the input to the multiplication. You cannot infer the resulting distance from the length number alone.
Now suppose the previous lower band was 97 and the previous close was above it. In the second case, the fresh lower band is 94, but the carry-forward rule retains 97. During an uptrend, that retained band can be the plotted Supertrend line. Reading 94 from the fresh-band arithmetic and expecting to see it on the chart would miss the indicator's memory.
Fewer flips have a cost
A wider band generally requires a larger opposing price move before direction changes. That can reduce sensitivity to small reversals, while also delaying a response to a real reversal. Because the bands carry history, do not expect every signal to shift by the same number of bars. Repeated crossings in a sideways market remain possible; widening a ruler does not give it foresight.
Also separate the indicator from your trade rule. Does a flip close an existing trade, open a new one, or do both? Does the rule wait for the bar to finish? A chart color alone leaves these decisions unanswered. Our RSI trading-rule guide shows the same distinction between an indicator reading and a precisely defined event.
Compare settings with one controlled experiment
Write down the symbol, data feed, timeframe, session, entry rule, exit rule and sizing rule first. Then compare a small, preselected set of multipliers while holding ATR length fixed. Repeat for length while holding the multiplier fixed. This is a suggested experiment, not a reported backtest.
Use standard price bars and account for commission and slippage. TradingView strategies simulate orders; their results depend on execution assumptions as well as signals. Its strategy documentation explains simulated fills and testing limitations. For a closer look at intrabar fill assumptions, see our Bar Magnifier guide.
Record trade count, drawdown and results after costs, then evaluate the unchanged rule on a later period that was not used to choose the settings. A setting that wins only on the selection period has answered a historical puzzle, not yet made a convincing case for future use. Keep the settings and the test conditions together; a pair of numbers without its experiment is a label on an empty bottle.