AlgoWay Blog
Guides, manuals and platform references.
Core
- All articles
- FAQ
- PineConnector alternative
- TradersPost alternative
- Automate TradingView alerts
- Automate Telegram signals
- AlgoWay CopyTrader
- cTrader Copier
- TrendSpider with AlgoWay
- How to Automate a TradingView Indicator with Dynamic SL/TP and 1% Risk on MT5
JSON & Alerts
- JSON schema
- Manual alerts
- TradingView without paid subscription
- AlgoWay Strategy Integration in Pine Script
- Python Trading Bot Webhook Integration
- TRALADAL - TradingView Alert Adapter
- TradingView Order Action Alert
MT5 / Expert Advisors
Errors
Integrations
- MetaTrader 5
- TradeLocker
- Match-Trader
- DXtrade
- Capital.Com
- Binance
- Bybit
- MEXC
- OKX
- Bitget
- Hyperliquid
- BingX
- Alpaca
- Interactive Brokers
- Gate.io
- Coinbase
- TooBit
- WEEX
- ProjectX
- cTrader logic
Other Publications
- MT5 EA Webhook JSON Reference
- OANDA MT5 with AlgoWay
- Buy Webhook via Buy Me a Coffee
- AlgoWay vs PineConnector
- Compare AlgoWay with other trading automation tools
- AlgoWay Red News Filter
- Why Paid Trading Indicators Avoid Verifiable Backtests
- How Trade Automation Tools Mislead You
- utomating a Prop-Firm Eval End to End:
- ATP Premium Indicator Testing Bot
- Why TradingView Backtests Win but Live Trades Lose
- Best Prop Firms for Trading Automation and Telegram Signal Copy in 2026
- Four AIs, One Trader, and the Strange Case of TradingView to Alpaca
- TradingView Automation
AlgoWay Strategy Lab
RSI Overbought and Oversold: Build Clear Trading Rules
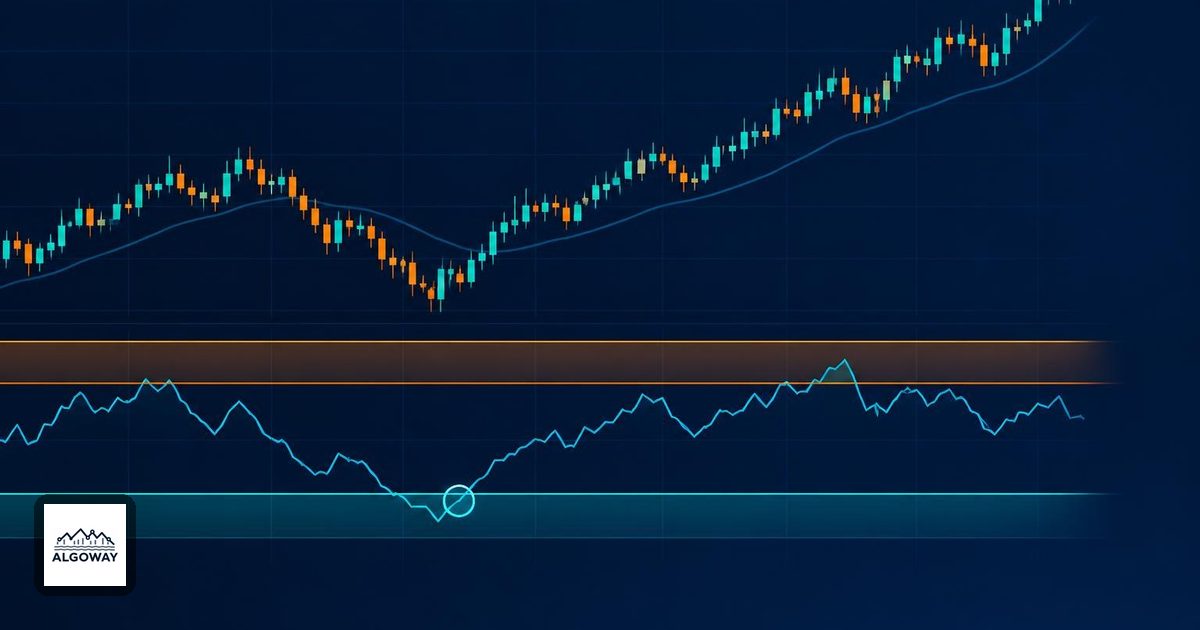
“Buy when RSI is oversold” sounds like a trading rule until two people try to program it. One buys the first dip below 30. Another waits for a recovery above 30. A third buys on every bar below the line. They agree on the indicator and disagree on nearly every trade.
RSI above 70 does not, by itself, mean sell immediately. Below 30 does not guarantee a rebound. To make either reading useful, specify the event you want, when you measure it, and what happens to an existing position.
What the RSI number actually measures
RSI compares smoothed upward and downward price changes and expresses their relationship on a scale from 0 to 100. TradingView's built-in indicator defaults to 14 bars and the closing price as its source. Fourteen bars on a five-minute chart is a different observation window from fourteen daily bars. The conventional overbought and oversold levels are 70 and 30. These settings and the calculation are documented in TradingView's RSI reference.
The number describes recent momentum. It is not a valuation model. An RSI of 75 does not say that an asset is 75% overpriced, and a reading of 25 supplies no price target.
Fidelity's RSI guide notes that strong trends can keep the indicator overbought or oversold for extended periods. A rule that sells every high reading is therefore making a reversal bet, not discovering a compulsory turning point. The market has not signed an agreement to turn at 70.
Three rules hiding inside one sentence
Consider these invented RSI readings on consecutive closed bars: 34, 29, 24, 28, 32. They illustrate rule logic, not a tested strategy or a price forecast.
| Rule | Qualifying readings | Question it answers |
|---|---|---|
| RSI is below 30 | 29, 24 and 28 | Is momentum currently in the oversold zone? |
| RSI crosses below 30 | 29 only | Has RSI just entered that zone? |
| RSI crosses back above 30 | 32 only | Has RSI just left that zone on the upside? |
For this example, define a downward crossing as a previous reading at or above 30 and a current reading below 30. Define an upward crossing as a previous reading at or below 30 and a current reading above 30. Writing the equality case down avoids an argument later when RSI lands exactly on the boundary.
A below-30 condition stays true for three bars here. Whether that creates three entries depends on the strategy's entry and position rules. A crossing condition identifies one transition in this sequence; it does not prevent another crossing after a later dip.
TradingView's documented RSI Strategy uses a recovery through the oversold boundary for a long entry and a downward crossing of the overbought boundary to reverse short. That is one particular rule set. It is not equivalent to buying whenever the indicator displays an oversold value.
Decide whether the bar must finish first
A developing candle can move an RSI reading across a threshold and back again. Suppose the previous closed reading was 29, the current bar briefly shows 31, and it finishes at 28. A rule observing the intrabar crossing and a rule requiring a closing reading above 30 will disagree for an understandable reason.
For a test built around closed-bar readings, evaluate the condition at bar close. Pine provides barstate.isconfirmed for identifying confirmed bars; TradingView describes its behavior in the bar-state documentation. This addresses the developing chart bar. It does not automatically repair unrelated higher-timeframe data or every other source of repainting.
Keep the signal time separate from the fill time. A confirmed signal is a decision, not a promise to transact at that candle's close. The TradingView strategy alert timing guide explains that separate execution question.
Turn the idea into an experiment you can repeat
Before comparing settings, write a short specification. For example: use RSI length 14 on ordinary five-minute closing prices; consider a long entry only after a confirmed crossing above 30; permit one position at a time; ignore additional long signals while that position remains open. This is an illustrative entry specification, not a complete trading recommendation.
It still needs an exit rule, a size rule and a maximum acceptable loss. Decide whether an opposite RSI signal closes the position, reverses it, or does nothing. Do not let that choice change halfway through a comparison.
Then compare the below-threshold and recovery-crossing ideas with the same instrument, period, costs, sizing and exits. Record trade count, drawdown and net results, not just how many entries look attractive on the chart. Keep a later period untouched while choosing settings so that it can challenge the choices afterward. No backtest or performance measurement was performed for this article.
Use the backtesting and forward-tracking guide for the next stage. Save the exact RSI rule beside the results. “RSI strategy” is a label; the crossing direction, bar timing and position rules are the experiment.