AlgoWay Blog
Guides, manuals and platform references.
Core
- All articles
- FAQ
- PineConnector alternative
- TradersPost alternative
- Automate TradingView alerts
- Automate Telegram signals
- AlgoWay CopyTrader
- cTrader Copier
- TrendSpider with AlgoWay
- How to Automate a TradingView Indicator with Dynamic SL/TP and 1% Risk on MT5
JSON & Alerts
- JSON schema
- Manual alerts
- TradingView without paid subscription
- AlgoWay Strategy Integration in Pine Script
- Python Trading Bot Webhook Integration
- TRALADAL - TradingView Alert Adapter
- TradingView Order Action Alert
MT5 / Expert Advisors
Errors
Integrations
- MetaTrader 5
- TradeLocker
- Match-Trader
- DXtrade
- Capital.Com
- Binance
- Bybit
- MEXC
- OKX
- Bitget
- Hyperliquid
- BingX
- Alpaca
- Interactive Brokers
- Gate.io
- Coinbase
- TooBit
- WEEX
- ProjectX
- cTrader logic
Other Publications
- MT5 EA Webhook JSON Reference
- OANDA MT5 with AlgoWay
- Buy Webhook via Buy Me a Coffee
- AlgoWay vs PineConnector
- Compare AlgoWay with other trading automation tools
- AlgoWay Red News Filter
- Why Paid Trading Indicators Avoid Verifiable Backtests
- How Trade Automation Tools Mislead You
- utomating a Prop-Firm Eval End to End:
- ATP Premium Indicator Testing Bot
- Why TradingView Backtests Win but Live Trades Lose
- Best Prop Firms for Trading Automation and Telegram Signal Copy in 2026
- Four AIs, One Trader, and the Strange Case of TradingView to Alpaca
- TradingView Automation
AlgoWay Strategy Lab
TradingView Bar Magnifier: Why Backtest Fills Change
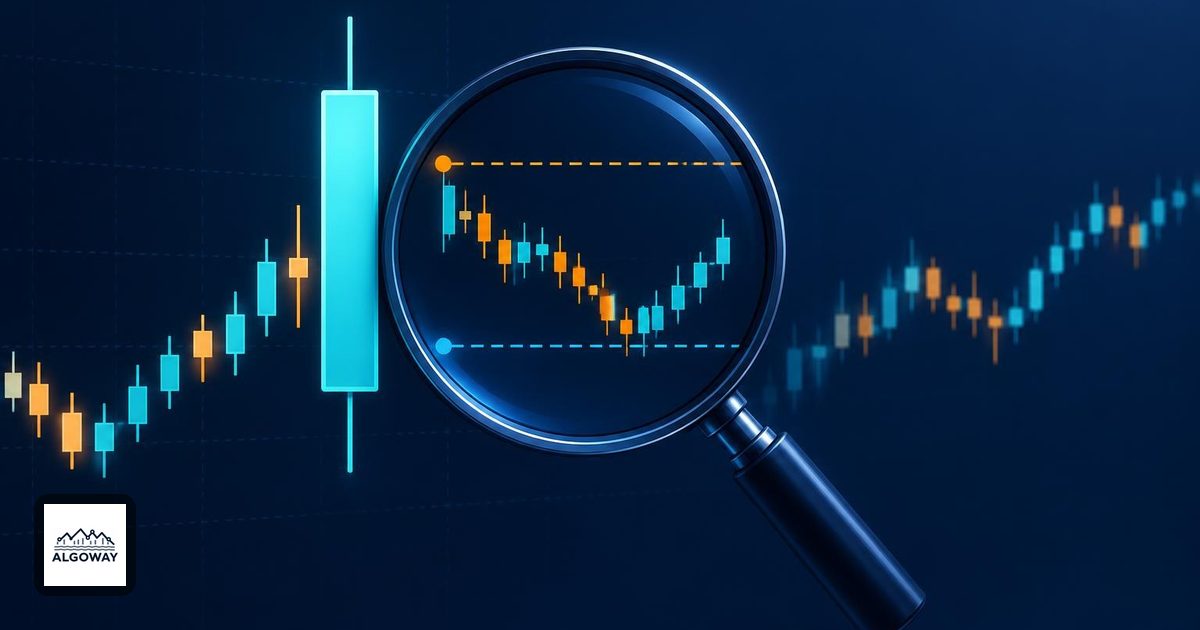
A backtest candle can contain both your entry price and your stop. That does not tell you which came first. A candle is a summary of the journey, not a recording of every turn.
TradingView Bar Magnifier uses lower-timeframe prices to refine simulated order fills. It can change whether an entry and exit happen inside the same chart bar. It cannot certify that a broker would have filled your trade that way.
Find the setting under its current name
TradingView's current Pine documentation calls this high historical bar detail: select High under Bar detalization in the strategy's Settings/Properties or strategy report. The documented plans are Premium and Ultimate. The Pine declaration still uses use_bar_magnifier = true. See TradingView's current strategy documentation.
The separate Bar Magnifier help page retains the older name. Its interval table maps a 60-minute chart to 10-minute intrabars and a daily chart to 60-minute intrabars. More detail here means smaller OHLC bars, not a complete exchange tick record.
One candle, two possible trade histories
Consider this invented example, not a measured backtest. A chart bar opens at 100, reaches 108, falls to 96 and closes at 104. Before the bar begins, a buy-stop entry is waiting at 106, with a protective stop at 99 once the position opens. Ignore costs and gaps for this illustration.
| Possible sequence | Meaning for the trade |
|---|---|
| 100 >> 96 >> 108 >> 104 | The low occurs before entry. After the buy at 106, the remaining path stays above 99. |
| 100 >> 108 >> 96 >> 104 | The buy at 106 happens first. The later decline crosses 99, so the stop can close the trade within this bar. |
Both paths produce identical chart OHLC values. In this deliberately simplified example, one leaves a position open and the other closes it. Smaller bars can establish an order of events that the larger candle hides. They may still leave uncertainty within each smaller bar.
Order availability also matters. A level drawn on the chart is not proof that an order existed when price crossed it. For that separate issue, read the explanation of strategy order creation and alert timing.
Why switching it on may change nothing
TradingView's Bar Magnifier help documents a maximum of 200,000 requested lower-timeframe bars. Earlier chart history may therefore lack magnified coverage. The covered span varies with the chart interval and available intrabars; do not treat a rough bar-count estimate as a fixed number of calendar days.
Unchanged results are also plausible when the finer sequence leads to the same fills. Start with a recent trade where entry and exit levels lie inside one chart candle. Compare its timestamps and prices before comparing the total profit. A setting that changes no relevant event has no reason to change the answer.
Keep fill detail separate from calculation timing
Historical detail and script execution are separate controls. Current TradingView documentation includes On history bar tick, On realtime bar tick and On order fill execution settings. Their interaction with available intrabar prices can affect when the script calculates and creates orders. Record them rather than assuming that every Bar Magnifier comparison uses the same calculation schedule. TradingView documents these execution controls separately.
For a useful comparison, save the symbol, chart type, interval, date range, strategy inputs, execution settings, commission and slippage assumptions. Change only historical detail first. Inspect a few affected trades, then investigate other settings individually. Changing five switches at once produces a new result and very little explanation.
Use the backtest-to-forward-test workflow for the next stage. Keep the simulated trade list alongside observed execution records. More detailed historical fills make a better question for forward testing; they are not the answer to what a live account actually received.