AlgoWay Blog
Guides, manuals and platform references.
Core
- All articles
- FAQ
- PineConnector alternative
- TradersPost alternative
- Automate TradingView alerts
- Automate Telegram signals
- AlgoWay CopyTrader
- cTrader Copier
- TrendSpider with AlgoWay
- How to Automate a TradingView Indicator with Dynamic SL/TP and 1% Risk on MT5
JSON & Alerts
- JSON schema
- Manual alerts
- TradingView without paid subscription
- AlgoWay Strategy Integration in Pine Script
- Python Trading Bot Webhook Integration
- TRALADAL - TradingView Alert Adapter
- TradingView Order Action Alert
- How to use Clone Mode
MT5 / Expert Advisors
Errors
Integrations
- MetaTrader 5
- Tradovate
- TradeLocker
- cTrader
- Match-Trader
- DXtrade
- Capital.Com
- Binance
- Bybit
- MEXC
- OKX
- Bitget
- Hyperliquid
- BingX
- Alpaca
- Interactive Brokers
- Gate.io
- Coinbase
- TooBit
- WEEX
- ProjectX
- Rithmic
Other Publications
- MT5 EA Webhook JSON Reference
- OANDA MT5 with AlgoWay
- Buy Webhook via Buy Me a Coffee
- AlgoWay vs PineConnector
- Compare AlgoWay with other trading automation tools
- AlgoWay Red News Filter
- Why Paid Trading Indicators Avoid Verifiable Backtests
- How Trade Automation Tools Mislead You
- utomating a Prop-Firm Eval End to End:
- ATP Premium Indicator Testing Bot
- Why TradingView Backtests Win but Live Trades Lose
- Best Prop Firms for Trading Automation and Telegram Signal Copy in 2026
- Four AIs, One Trader, and the Strange Case of TradingView to Alpaca
- TradingView Automation
AlgoWay Strategy Lab
Moving Average Crossover Whipsaws: Causes and Filters
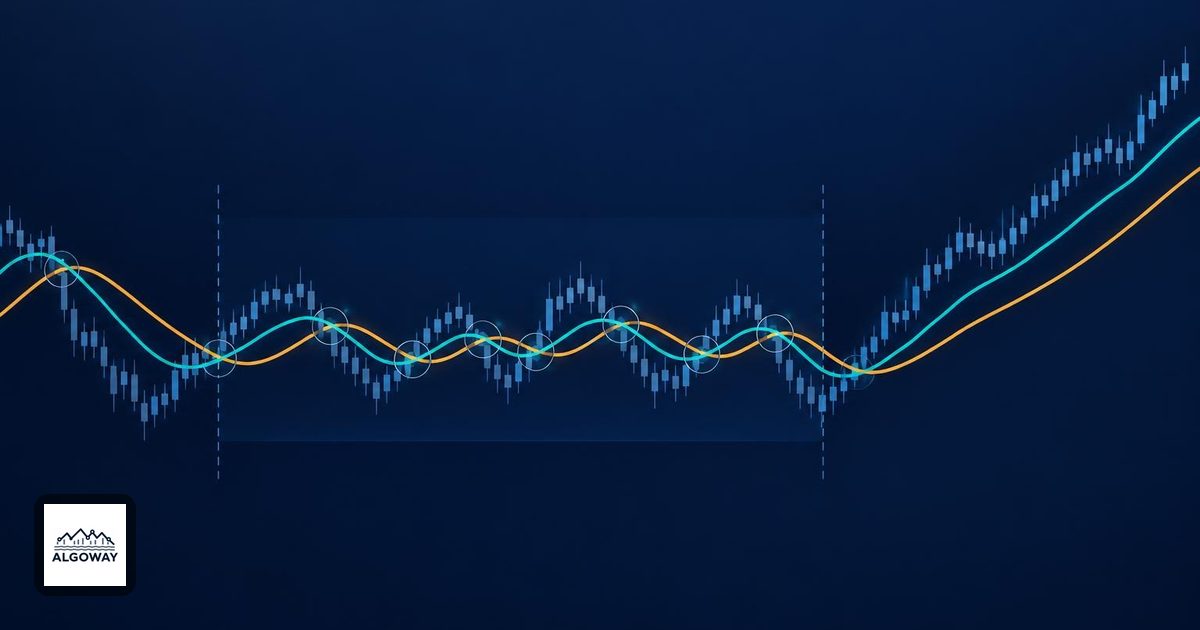
Two moving averages can cross perfectly and still produce a poor trade. In a sideways market, each small rally can pull the faster average above the slower one, only for the next decline to pull it back below. The signal is doing its arithmetic. The market has declined to provide a trend.
A moving-average whipsaw is a directional signal followed by a reversal before the trade captures a sustained move. Repeated crossings matter especially in TradingView automation: turning every cross into an order can turn a quiet range into a busy account. Before connecting a rule to AlgoWay's TradingView-to-MT5 workflow, decide what counts as a new signal, what an opposite signal does, and which conditions allow an entry.
Why the averages keep changing places
A simple moving average gives equal weight to the observations in its window. A shorter window responds more directly to recent prices; a longer one carries more older information. Both look backward. Changing to an exponential average changes the weighting, not the fact that the input is past and current price. TradingView describes this lag and the limitations of two-average signals in its moving-average reference.
When price travels persistently in one direction, the averages can stay separated. When price repeatedly returns toward the same area, their ordering can reverse repeatedly too. A longer setting may smooth some fluctuations but also delay recognition of a genuine turn. There is no length that can identify a future trend by declaration.
A tiny sideways example with two valid crossings
Consider these invented closing prices: 100, 100, 100, 102, 100, 98, 100, 102. Use a two-bar SMA as the fast average and a four-bar SMA as the slow average. These deliberately short windows make the arithmetic visible; they are not suggested trading settings.
| Bar | Close | Fast SMA | Slow SMA | Relationship |
|---|---|---|---|---|
| 4 | 102 | 101 | 100.5 | Fast above slow |
| 5 | 100 | 101 | 100.5 | Still above |
| 6 | 98 | 99 | 100 | Cross below |
| 7 | 100 | 99 | 100 | Still below |
| 8 | 102 | 101 | 100 | Cross above |
Only the two crossings shown after bar 4 can be established from these displayed rows. Bar 4 establishes the starting relationship, not a proven prior crossover. Price ends back at 102, yet a system reversing on the later crossings has changed direction twice. Nothing in this example measures actual fills or profitability. It demonstrates how a bounded price path produces changing signals without a sustained trend.
A cross is an event; being above is a state
For a precise long signal, define the fast average as above the slow average now and at or below it on the previous bar. “Fast is above slow” alone stays true on subsequent bars and is a different rule. TradingView's MovingAvg2Line Cross strategy uses crossings in opposite directions for long and short entries.
Also choose whether the decision waits for the chart bar to close. An unfinished bar can move the averages across each other and back again. TradingView's Pine alert documentation explains close-only alert frequency and the different event sources available to strategies. Waiting for a close can remove an intrabar cross that disappears; it cannot prevent a confirmed cross from losing on the next bar. Match script calculation behavior and alert type to the rule.
Filters change the trade, not just the chart
These are candidate rules to evaluate, not proven improvements:
- Slope filter: permit a long entry only if the slow average is higher than it was a specified number of bars ago. Define that lookback explicitly. A nearly flat average can still satisfy a positive-slope test.
- Separation filter: require the fast average to exceed the slow one by a stated distance or percentage. This avoids acting on very small differences but can enter later.
- Persistence filter: require the bullish relationship to survive several closed bars. This rejects some brief reversals while missing or delaying some valid moves.
- Trend-strength filter: test a separate strength condition. Our ADX strength-versus-direction guide explains why a strong ADX reading alone does not tell you to buy.
There is a small trap in combining these rules. If the averages cross today but the separation threshold is reached tomorrow, a rule requiring both conditions on the crossover bar will never enter tomorrow. A rule that remembers the cross and waits for confirmation might. Those are different strategies. For the waiting version, specify when the pending setup expires and whether an opposite cross cancels it.
Compare the cost of fewer signals
Keep an unfiltered baseline, then change one rule at a time over the same data. Record trade count, entry delay, average win, average loss, drawdown and costs. Inspect the trades the filter removes as well as those it preserves. A lower trade count is not itself evidence of a better strategy.
Reserve a later period that was not used to choose the settings, and compare both trending and ranging stretches without defining those stretches using future information inside the trading rule. Include plausible spread, commission and slippage assumptions. The expectancy calculation helps reveal whether avoiding small losses also removed the few large winners that paid for them.
Finally, write down the exit policy independently: does a blocked opposite entry still close an existing position, or does it do nothing? A filter intended to reduce new trades can otherwise quietly change how long risk stays open. That decision belongs in the strategy specification before the first automated order.