AlgoWay Blog
Guides, manuals and platform references.
Core
- All articles
- FAQ
- PineConnector alternative
- TradersPost alternative
- Automate TradingView alerts
- Automate Telegram signals
- AlgoWay CopyTrader
- cTrader Copier
- TrendSpider with AlgoWay
- How to Automate a TradingView Indicator with Dynamic SL/TP and 1% Risk on MT5
JSON & Alerts
- JSON schema
- Manual alerts
- TradingView without paid subscription
- AlgoWay Strategy Integration in Pine Script
- Python Trading Bot Webhook Integration
- TRALADAL - TradingView Alert Adapter
- TradingView Order Action Alert
- How to use Clone Mode
MT5 / Expert Advisors
Errors
Integrations
- MetaTrader 5
- Tradovate
- TradeLocker
- cTrader
- Match-Trader
- DXtrade
- Capital.Com
- Binance
- Bybit
- MEXC
- OKX
- Bitget
- Hyperliquid
- BingX
- Alpaca
- Interactive Brokers
- Gate.io
- Coinbase
- TooBit
- WEEX
- KuCoin
- Kraken
- ProjectX
- Rithmic
Other Publications
- MT5 EA Webhook JSON Reference
- OANDA MT5 with AlgoWay
- Buy Webhook via Buy Me a Coffee
- AlgoWay vs PineConnector
- Compare AlgoWay with other trading automation tools
- AlgoWay Red News Filter
- Why Paid Trading Indicators Avoid Verifiable Backtests
- How Trade Automation Tools Mislead You
- utomating a Prop-Firm Eval End to End:
- ATP Premium Indicator Testing Bot
- Why TradingView Backtests Win but Live Trades Lose
- Best Prop Firms for Trading Automation and Telegram Signal Copy in 2026
- Four AIs, One Trader, and the Strange Case of TradingView to Alpaca
- TradingView Automation
AlgoWay Strategy Lab
Stochastic RSI vs RSI: Why Overbought Readings Differ
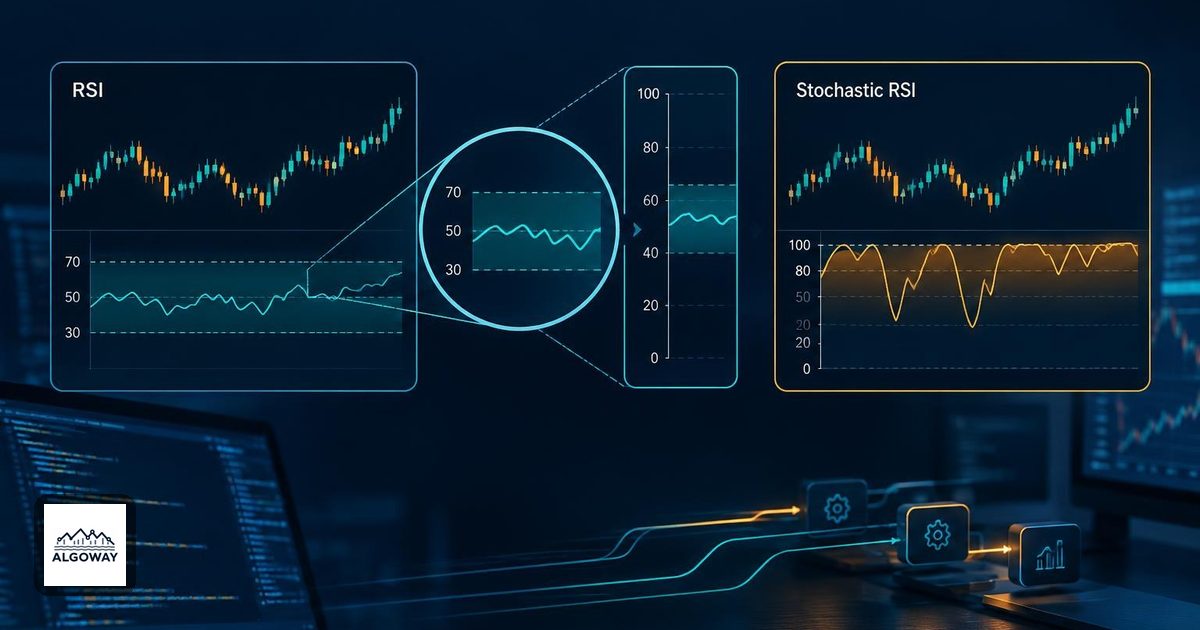
RSI reads 55. Stochastic RSI is pressed against the top of its scale. One panel looks unremarkable; the other looks overheated. Neither has to be broken. They are answering different questions.
RSI measures the balance of recent gains and losses. Stochastic RSI measures where that RSI value sits inside its own recent range. A moderate RSI can therefore produce an extreme Stochastic RSI reading. For TradingView automation, substituting one condition for the other changes the signal, even when both rules use the word “overbought.”
Before connecting a condition to an execution workflow, write down which oscillator and which line must cross which level. The AlgoWay guide to RSI trading rules explains the separate choice between entering a zone and leaving it. That choice still matters after you switch indicators.
A high reading inside a modest range
TradingView documents the raw calculation as the current RSI minus its lowest value in the lookback, divided by the difference between the highest and lowest RSI values:
Raw Stoch RSI = (current RSI − lowest RSI) / (highest RSI − lowest RSI)
The ratio runs from 0 to 1. Multiplying by 100 expresses the same result on a 0–100 scale. Thus 0.80 and 80 are equivalent only after accounting for the scale; neither means RSI itself is 80.
Consider these invented inputs. They illustrate the arithmetic, not a market observation or backtest. Assume the high and low differ, and ignore line smoothing for now.
| Current RSI | Lowest RSI | Highest RSI | Raw Stoch RSI |
|---|---|---|---|
| 55 | 45 | 55 | (55 − 45) / 10 = 1.00, or 100 |
| 53 | 45 | 55 | (53 − 45) / 10 = 0.80, or 80 |
| 72 | 70 | 80 | (72 − 70) / 10 = 0.20, or 20 |
The last row reverses the apparent contradiction: RSI is above the conventional 70 threshold while raw Stochastic RSI is near the bottom of its range. The range supplies the missing context. A person can be the tallest in a small room without being tall enough for professional basketball.
The denominator can do much of the moving
Hold the hypothetical RSI at 53. With a recent range of 45 to 55, the raw result is 80. With a range of 35 to 65, it is 60. The same current RSI produces different normalized readings because the reference range changed.
This also explains why comparing only the latest RSI values cannot reproduce a Stochastic RSI series. You need the relevant history. As old observations leave a rolling window, its extremes can change. If the highest and lowest RSI are equal, the displayed formula divides by zero; a custom implementation needs an explicit policy for that case. Do not silently turn an undefined calculation into a buy signal.
Check the plotted line before checking the alert
TradingView exposes separate RSI Length, Stochastic Length, K and D inputs. Its conventional Stochastic RSI zones are 0.80 and 0.20, compared with RSI's familiar 70 and 30. A displayed K or D line can differ from the raw ratio because the line calculation adds smoothing. Match the chosen line and its settings before comparing numbers.
The official RSI reference explains the underlying gain/loss calculation. Changing the RSI input changes the series that is subsequently normalized; changing the stochastic lookback changes the range used to normalize it. Those are different adjustments, despite both being described as a “length.”
Translate the observation into one testable event
On a 0–100 display, “K is above 80,” “K crosses above 80,” and “K crosses below 80” are three different conditions. The first describes a state. The next two describe transitions in opposite directions. A K/D crossover is a fourth rule, with no necessary requirement that either line be near 80.
For a reproducible experiment, record the symbol and feed, chart timeframe, RSI source and length, stochastic length, line smoothing, selected line, threshold scale and whether the rule uses a finished bar. Specify the exit and position size separately. None of those instructions follows automatically from an overbought label.
Compare the two indicators with the other strategy rules held constant, then inspect the actual signal timestamps. If the intended event depends on a higher timeframe, the higher-timeframe confirmation guide covers why closing the chart bar alone may not settle the requested data. The useful question is whether the rule observed the value you intended, not which oscillator looked more urgent.