AlgoWay Blog
Guides, manuals and platform references.
Core
- All articles
- FAQ
- PineConnector alternative
- TradersPost alternative
- Automate TradingView alerts
- Automate Telegram signals
- AlgoWay CopyTrader
- cTrader Copier
- TrendSpider with AlgoWay
- How to Automate a TradingView Indicator with Dynamic SL/TP and 1% Risk on MT5
JSON & Alerts
- JSON schema
- Manual alerts
- TradingView without paid subscription
- AlgoWay Strategy Integration in Pine Script
- Python Trading Bot Webhook Integration
- TRALADAL - TradingView Alert Adapter
- TradingView Order Action Alert
- How to use Clone Mode
MT5 / Expert Advisors
Errors
Integrations
- MetaTrader 5
- Tradovate
- TradeLocker
- cTrader
- Match-Trader
- DXtrade
- Capital.Com
- Binance
- Bybit
- MEXC
- OKX
- Bitget
- Hyperliquid
- BingX
- Alpaca
- Interactive Brokers
- Gate.io
- Coinbase
- TooBit
- WEEX
- KuCoin
- Kraken
- ProjectX
- Rithmic
Other Publications
- MT5 EA Webhook JSON Reference
- OANDA MT5 with AlgoWay
- Buy Webhook via Buy Me a Coffee
- AlgoWay vs PineConnector
- Compare AlgoWay with other trading automation tools
- AlgoWay Red News Filter
- Why Paid Trading Indicators Avoid Verifiable Backtests
- How Trade Automation Tools Mislead You
- utomating a Prop-Firm Eval End to End:
- ATP Premium Indicator Testing Bot
- Why TradingView Backtests Win but Live Trades Lose
- Best Prop Firms for Trading Automation and Telegram Signal Copy in 2026
- Four AIs, One Trader, and the Strange Case of TradingView to Alpaca
- TradingView Automation
AlgoWay Strategy Lab
KAMA Efficiency Ratio: Why Equal Price Moves Differ
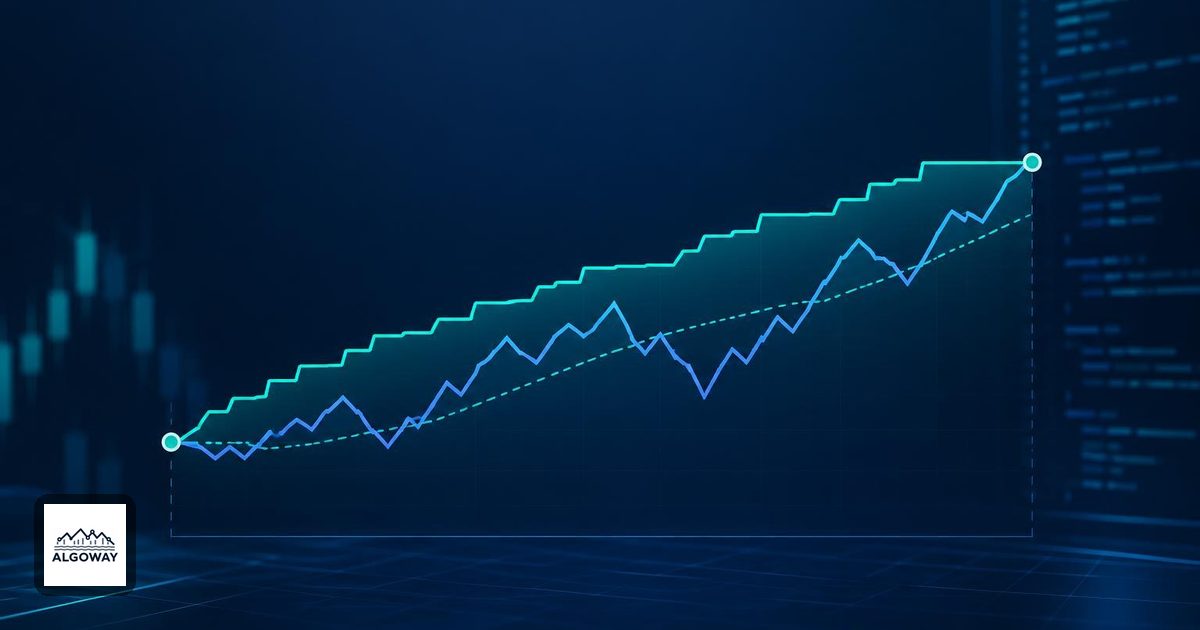
Two markets can rise five points while taking very different journeys. One climbs steadily. The other wanders up and down before arriving at the same destination. Kaufman's Adaptive Moving Average, or KAMA, gives those journeys different smoothing weights.
KAMA responds to how direct the movement was, not simply how far the price moved. Its efficiency ratio compares net displacement with the distance accumulated along the way. That distinction matters when an automated trading rule turns a price crossing into an entry: a changing average changes the crossing itself.
If you are preparing a KAMA-based rule for AlgoWay, use the indicator-to-strategy and alert workflow guide alongside the calculation below. Decide what constitutes a signal before preparing its execution message. A responsive line is still only one ingredient in a trade.
Measure the journey before choosing the weight
For a lookback of N price changes, take the absolute difference between the latest price and the price N bars ago. Divide it by the sum of the absolute one-bar changes over that interval. This is the efficiency ratio, ER. You need N + 1 price observations to measure N changes.
TradingView documents this calculation in its KAMA reference. The source can be a selected price series; the example here uses closing prices.
ER = absolute net change / sum of absolute one-bar changesConsider these invented six-close sequences, each covering five changes. They are arithmetic examples, not backtest results.
| Path | Six closes | Net change | Total distance | ER |
|---|---|---|---|---|
| Direct climb | 100, 101, 102, 103, 104, 105 | 5 | 5 | 1.00 |
| Detour | 100, 104, 101, 106, 102, 105 | 5 | 19 | 0.2632 |
The detour travels 4 + 3 + 5 + 4 + 3 = 19 points to gain five. The direct climb travels five to gain five. Both finish at 105; they do not earn the same efficiency score.
Reverse the direct path, from 105 down to 100, and ER remains 1. Absolute values remove direction. An efficient decline is still efficient. Therefore, “ER is high” cannot by itself mean “buy.” If every observation is identical, both numerator and denominator are zero; check the selected implementation's flat-window handling instead of dividing by zero.
The square makes a substantial difference
KAMA blends two EMA-style factors and then squares the result. With a fast length of 2 and a slow length of 30, the initial factors are 2/3 and 2/31. MetaTrader's Adaptive Moving Average documentation also describes the squared factor and recursive update.
fast factor = 2 / (fast length + 1)
slow factor = 2 / (slow length + 1)
weight = [ER × (fast factor - slow factor) + slow factor]²
new KAMA = previous KAMA + weight × (current price - previous KAMA)
Using those two lengths, the direct path produces a weight of about 0.4444. The detour produces about 0.0497. To isolate the effect of that weight, suppose both calculations start this one update with a previous KAMA of 100 and a current price of 105:
- Direct path: 100 + 0.4444 × 5 = approximately 102.2222.
- Detour: Using the unrounded weight: 100 + weight × 5 = approximately 100.2486.
This is a controlled single-update illustration. A full recursive calculation on the two price histories would generally have different previous KAMA values. Do not mistake the shared starting value for a claim that both complete histories produce it.
There is another useful consequence of the square. Even at ER = 1, the weight is (2/3)², not 2/3. A fast length of 2 does not make the final KAMA update identical to a two-period EMA. At ER = 0, the weight is (2/31)², approximately 0.00416. Forgetting the square produces a materially different indicator.
Settings change different parts of the calculation
The ER length chooses the span used to judge the journey. The fast and slow lengths set the factors that are blended. Changing the ER length is therefore not the same operation as changing one of the smoothing limits. TradingView also exposes source and timeframe choices in its documented KAMA inputs.
For a useful comparison, hold the symbol, source, timeframe and history constant, then change one input. Compare the resulting entry events as well as the visual smoothness. A quieter line may skip an unwanted crossing, but it may also recognize a genuine turn later. The existing moving-average whipsaw guide explains that trade-off for crossing filters.
Specify the event that the automation will act on
One testable example is: on a completed chart bar, the current close is above the current KAMA, while the previous close was at or below the previous KAMA. This describes a crossing event. “Close is above KAMA” describes a state that can last for many bars. The two rules would send different sequences of instructions.
Record whether you use that crossing, a change in KAMA slope, or a price condition combined with a separate directional filter. Also record what happens when a position is already open. The indicator formula does not answer whether another signal should add size, be ignored, or close an opposite position.
If KAMA uses a higher timeframe than the chart, resolve confirmation separately; see higher-timeframe alerts and confirmed values. Then test the complete entry, exit and sizing rules with realistic costs. KAMA can distinguish a straight road from a winding one. It cannot promise that either road leads to a profitable next trade.