AlgoWay Blog
Guides, manuals and platform references.
Core
- All articles
- FAQ
- PineConnector alternative
- TradersPost alternative
- Automate TradingView alerts
- Automate Telegram signals
- AlgoWay CopyTrader
- cTrader Copier
- TrendSpider with AlgoWay
- How to Automate a TradingView Indicator with Dynamic SL/TP and 1% Risk on MT5
JSON & Alerts
- JSON schema
- Manual alerts
- TradingView without paid subscription
- AlgoWay Strategy Integration in Pine Script
- Python Trading Bot Webhook Integration
- TRALADAL - TradingView Alert Adapter
- TradingView Order Action Alert
- How to use Clone Mode
MT5 / Expert Advisors
Errors
Integrations
- MetaTrader 5
- Tradovate
- TradeLocker
- cTrader
- Match-Trader
- DXtrade
- Capital.Com
- Binance
- Bybit
- MEXC
- OKX
- Bitget
- Hyperliquid
- BingX
- Alpaca
- Interactive Brokers
- Gate.io
- Coinbase
- TooBit
- WEEX
- KuCoin
- Kraken
- ProjectX
- Rithmic
Other Publications
- MT5 EA Webhook JSON Reference
- OANDA MT5 with AlgoWay
- Buy Webhook via Buy Me a Coffee
- AlgoWay vs PineConnector
- Compare AlgoWay with other trading automation tools
- AlgoWay Red News Filter
- Why Paid Trading Indicators Avoid Verifiable Backtests
- How Trade Automation Tools Mislead You
- utomating a Prop-Firm Eval End to End:
- ATP Premium Indicator Testing Bot
- Why TradingView Backtests Win but Live Trades Lose
- Best Prop Firms for Trading Automation and Telegram Signal Copy in 2026
- Four AIs, One Trader, and the Strange Case of TradingView to Alpaca
- TradingView Automation
AlgoWay Strategy Lab
VWMA vs SMA: How Volume Changes the Trading Signal
Published: 2026-11-12 | AlgoWay | View Markdown
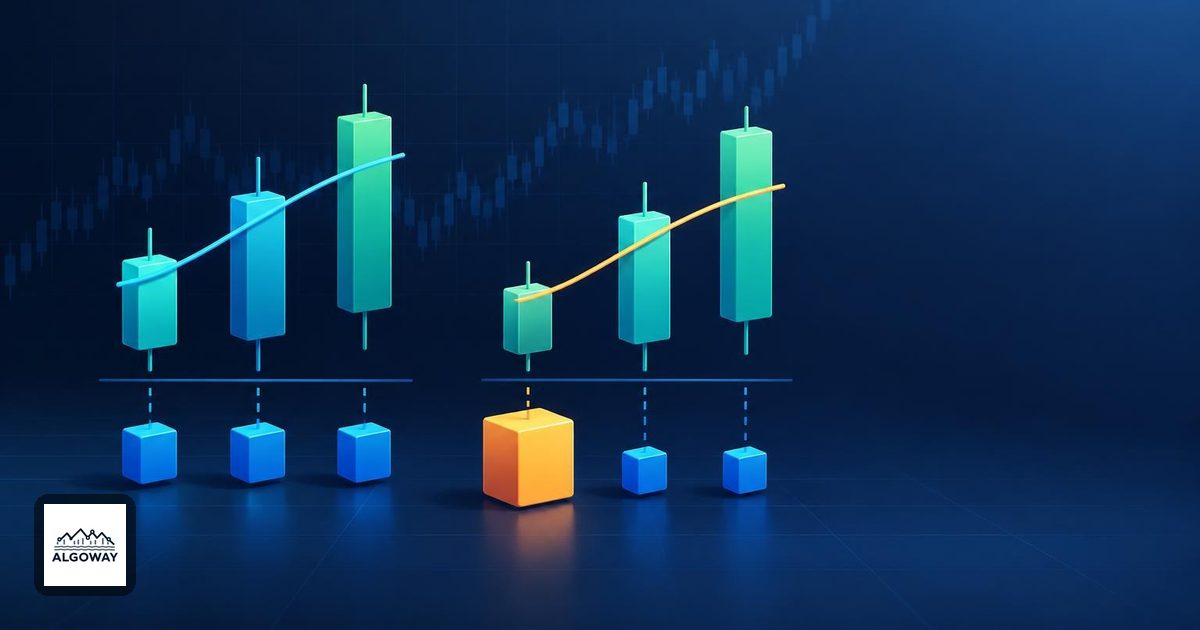
The prices are identical. The moving averages are not. That is possible when one average gives every candle an equal vote and the other lets volume decide how much each vote counts.
VWMA is a rolling average of prices weighted by their bars' volume. SMA gives each price equal weight. Comparing them over the same window isolates the effect of volume weighting. It does not establish that one line predicts the next trade better.
For TradingView automation, this distinction belongs in the signal definition. A price crossing VWMA and VWMA crossing SMA are different events. When using AlgoWay to automate TradingView alerts, decide which event should create the alert before configuring the execution route. A connector cannot resolve an ambiguous trading rule.
Calculate both averages from the same prices
For a window of N bars, using closing prices:
- SMA = sum of closes / N.
- VWMA = sum of (close × volume) / sum of volume.
TradingView's VWMA documentation describes this difference in weighting. The denominator matters: dividing the weighted price total by the number of bars would not produce VWMA.
Here is a hypothetical three-bar window. The units of volume are consistent within each example; these are arithmetic illustrations, not market observations or backtest results.
| Bar, oldest first | Close | Volume A | Close × volume A | Volume B | Close × volume B |
|---|---|---|---|---|---|
| 1 | 100 | 10 | 1,000 | 90 | 9,000 |
| 2 | 102 | 10 | 1,020 | 10 | 1,020 |
| 3 | 104 | 80 | 8,320 | 10 | 1,040 |
| Total | 306 | 100 | 10,340 | 110 | 11,060 |
SMA is 306 / 3 = 102 in both cases. With volume A, VWMA is 10,340 / 100 = 103.40. With volume B, it is 11,060 / 110 = 100.55, rounded to two decimals.
The closes rise in both examples, yet volume B puts VWMA below SMA. The oldest, lowest close carries most of the weight. Consequently, “VWMA below SMA” does not mean that the latest candle fell or that the closes in the window are declining.
What the gap between the lines actually measures
For matching windows and price sources, subtracting SMA from the weighted average gives:
VWMA − SMA = sum of [volume × (close − SMA)] / sum of volume.
This identity explains the example without a story about buyers winning or sellers losing. More weight on prices above the window's ordinary mean pulls VWMA upward; more weight below it pulls VWMA downward. The gap describes how volume and price levels line up inside that window.
Two useful checks follow from the arithmetic. Equal volume on every bar makes VWMA equal SMA. Multiplying every volume in a window by the same positive constant leaves VWMA unchanged, because the numerator and denominator grow together. A larger total volume alone does not force the average higher.
With nonnegative volumes and a positive total, the weighted average also stays between the lowest and highest prices used in the calculation. If your hand calculation violates that bound, check the denominator and bar alignment before blaming the market.
A rolling window is not a session anchor
A three-bar VWMA replaces its oldest observation when a new bar enters. That departing bar loses its entire contribution, including its volume weight. A line can therefore shift because a heavily weighted old bar leaves, not just because the latest close makes a large move.
VWAP can also weight prices by volume, but TradingView's VWAP accumulates from its selected anchor and resets according to that setting. Its default price source is HLC3. Comparing a close-based rolling VWMA with a session VWAP can change both the window and the price source. Our VWAP reset guide explains that separate choice.
Turn the comparison into one testable event
Suppose the intended rule is a bullish VWMA/SMA crossing on completed bars. Define it as VWMA at or below SMA on the previous completed bar, then strictly above SMA on the current completed bar. That is different from repeatedly entering whenever VWMA remains above SMA.
A close crossing above VWMA asks another question. It compares one price with an average, rather than comparing weighted and unweighted averages. Neither rule automatically specifies an exit, stop distance or order size. Write those decisions separately, and handle unavailable prices or volume explicitly rather than silently replacing missing values with zero.
Before comparing chart signals, hold the symbol feed, timeframe, price source, length and evaluation timing fixed. Then inspect the volume inputs and the bar that left the window. If crossings remain frequent in sideways prices, volume weighting has not repealed whipsaws; the moving-average crossover guide discusses the trade-offs of filters.
The first useful test is modest: reproduce a few completed-bar values and explain every difference between the two lines. Profitability is a separate question that requires costs, exits and out-of-sample evidence.