AlgoWay Blog
Guides, manuals and platform references.
Core
- All articles
- FAQ
- PineConnector alternative
- TradersPost alternative
- Automate TradingView alerts
- Automate Telegram signals
- AlgoWay CopyTrader
- cTrader Copier
- TrendSpider with AlgoWay
- How to Automate a TradingView Indicator with Dynamic SL/TP and 1% Risk on MT5
JSON & Alerts
- JSON schema
- Manual alerts
- TradingView without paid subscription
- AlgoWay Strategy Integration in Pine Script
- Python Trading Bot Webhook Integration
- TRALADAL - TradingView Alert Adapter
- TradingView Order Action Alert
- How to use Clone Mode
MT5 / Expert Advisors
Errors
Integrations
- MetaTrader 5
- Tradovate
- TradeLocker
- cTrader
- Match-Trader
- DXtrade
- Capital.Com
- Binance
- Bybit
- MEXC
- OKX
- Bitget
- Hyperliquid
- BingX
- Alpaca
- Interactive Brokers
- Gate.io
- Coinbase
- TooBit
- WEEX
- KuCoin
- Kraken
- ProjectX
- Rithmic
Other Publications
- MT5 EA Webhook JSON Reference
- OANDA MT5 with AlgoWay
- Buy Webhook via Buy Me a Coffee
- AlgoWay vs PineConnector
- Compare AlgoWay with other trading automation tools
- AlgoWay Red News Filter
- Why Paid Trading Indicators Avoid Verifiable Backtests
- How Trade Automation Tools Mislead You
- utomating a Prop-Firm Eval End to End:
- ATP Premium Indicator Testing Bot
- Why TradingView Backtests Win but Live Trades Lose
- Best Prop Firms for Trading Automation and Telegram Signal Copy in 2026
- Four AIs, One Trader, and the Strange Case of TradingView to Alpaca
- TradingView Automation
AlgoWay Strategy Lab
Ultimate Oscillator: How Three Windows Weight Momentum
Published November 22, 2026 · View Markdown
A strong week can sit inside an ordinary month. The Ultimate Oscillator makes that disagreement part of its calculation: recent buying pressure gets the largest weight, but older bars still have a vote. A short-window reading of 80 therefore need not produce an Ultimate Oscillator reading of 80.
For TradingView automation, that distinction changes the event you send downstream. Specify whether your condition uses the combined oscillator or only its shortest component before preparing an alert. In an AlgoWay workflow, the indicator-to-strategy guide is a useful next step for separating the indicator rule from the execution instruction. A connector cannot resolve an ambiguous definition of “strong momentum.”
Start with pressure inside the price range
For each bar, take the lower of its low and the previous close as a reference floor. Buying pressure is the current close minus that floor. True range is the higher of the current high and previous close, minus the same floor. These are price-derived quantities, not measurements of buyer order flow or traded volume. The definitions and weighted formula are documented in Fidelity’s Ultimate Oscillator guide.
Consider an invented bar with previous close 100, high 106, low 102 and close 105. The reference floor is 100, so buying pressure is 5 and true range is 6. Using only high minus low would give a range of 4 and omit the gap. That would be a different calculation.
For each lookback, divide the sum of buying pressure by the sum of true range. Do not average individual bars’ pressure-to-range percentages. With two hypothetical bars whose pressure/range pairs are 1/2 and 9/10, the ratio of sums is 10/12, or about 0.8333. The simple mean of 0.5 and 0.9 is 0.7. The larger-range bar matters more in the ratio of sums.
Three overlapping windows, unequal weights
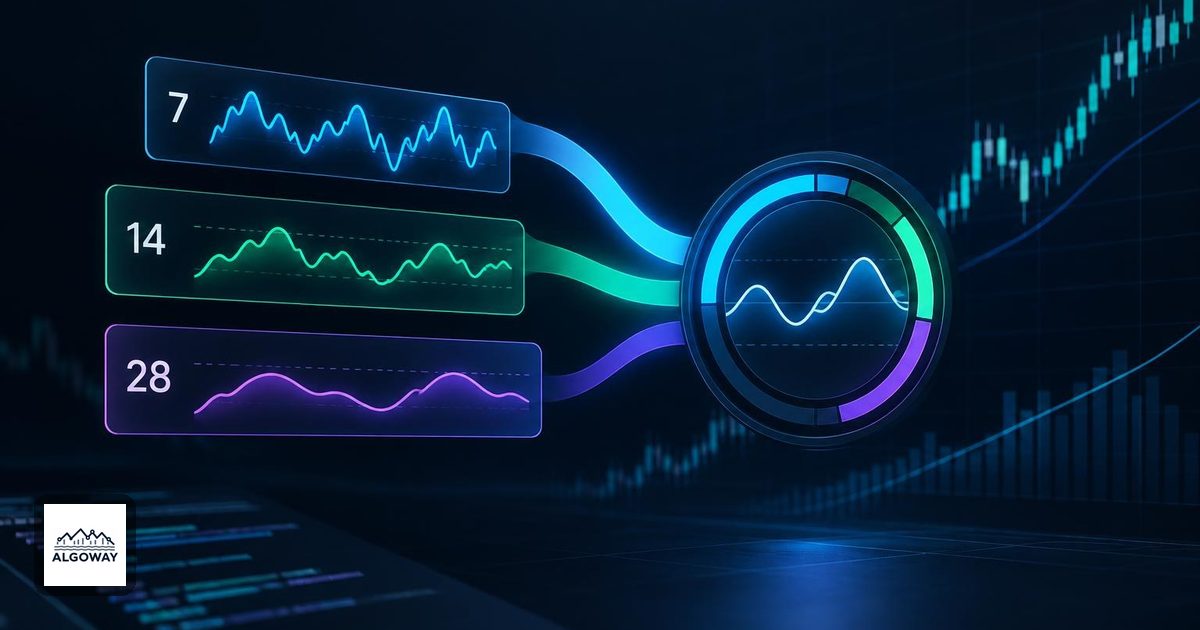
TradingView’s default lengths are 7, 14 and 28 bars. Their ratios receive weights of 4, 2 and 1, respectively; multiply the weighted average by 100. These are lookback lengths on the selected chart, not a requirement to request three separate chart timeframes. See TradingView’s calculation and input documentation.
Here is an invented set of internally consistent totals. The longer windows include the shorter ones.
| Lookback | Pressure sum | True-range sum | Ratio | Weight |
|---|---|---|---|---|
| Latest 7 bars | 56 | 70 | 0.80 | 4 |
| Latest 14 bars | 84 | 140 | 0.60 | 2 |
| Latest 28 bars | 112 | 280 | 0.40 | 1 |
The combined reading is:
100 × (4 × 0.80 + 2 × 0.60 + 1 × 0.40) / 7
= 68.57, approximately
The short component, expressed on a 0–100 scale, reads 80. The final oscillator remains below 70. Nothing is broken: the older observations pull the combined value down.
This is not three independent confirmations. The latest seven bars contribute to all three rows. For example, increase buying pressure by 7 within those latest bars while holding the range sums fixed and staying within valid bar ranges. All three pressure sums rise by 7. Their ratios become 0.90, 0.65 and 0.425, giving a combined reading of about 76.07. Changing only the first row would fail to represent the overlapping windows.
These numbers demonstrate arithmetic, not a tested strategy or a prediction of the next price move.
A level is not yet a trading instruction
TradingView describes divergence setups with several stages: a price/oscillator disagreement, an oscillator extreme and a subsequent break of an intervening oscillator level. Merely crossing 70 is not that complete bearish-divergence setup. Nor does a high reading force an immediate reversal. The RSI trading-rule discussion addresses a related distinction between a state and an event, using a different indicator calculation.
Suppose you choose a simpler experimental rule: signal when the completed oscillator reading moves from at most 70 to above 70. That is your threshold rule, not a claim to implement the documented divergence method. A value of 72 on three consecutive completed bars describes three above-threshold states but only one fresh crossing, assuming the preceding value was at most 70.
If you choose divergence instead, write down how swing points are identified and when they become knowable. A pivot drawn on an earlier candle may require later candles for confirmation. Record the detection time separately from the swing’s chart location before connecting the condition to orders.
Compare the inputs before comparing the alerts
When two implementations disagree, compare the exact symbol, chart timeframe, bar data, three lengths and completed-bar values. Then compare pressure sums, range sums and the weighted result in that order. Define what happens when a range denominator is zero or there is insufficient history; do not silently turn an unavailable reading into a buy or sell condition.
Finally, keep an audit row with the bar time, three component ratios, combined value and chosen event. That record can distinguish a calculation mismatch from an alert rule mismatch. It is much more useful than two screenshots whose lines merely look close.