AlgoWay Blog
Guides, manuals and platform references.
Core
- All articles
- FAQ
- PineConnector alternative
- TradersPost alternative
- Automate TradingView alerts
- Automate Telegram signals
- AlgoWay CopyTrader
- cTrader Copier
- TrendSpider with AlgoWay
- How to Automate a TradingView Indicator with Dynamic SL/TP and 1% Risk on MT5
JSON & Alerts
- JSON schema
- Manual alerts
- TradingView without paid subscription
- AlgoWay Strategy Integration in Pine Script
- Python Trading Bot Webhook Integration
- TRALADAL - TradingView Alert Adapter
- TradingView Order Action Alert
- How to use Clone Mode
MT5 / Expert Advisors
Errors
Integrations
- MetaTrader 5
- Tradovate
- TradeLocker
- cTrader
- Match-Trader
- DXtrade
- Capital.Com
- Binance
- Bybit
- MEXC
- OKX
- Bitget
- Hyperliquid
- BingX
- Alpaca
- Interactive Brokers
- Gate.io
- Coinbase
- TooBit
- WEEX
- KuCoin
- Kraken
- ProjectX
- Rithmic
Other Publications
- MT5 EA Webhook JSON Reference
- OANDA MT5 with AlgoWay
- Buy Webhook via Buy Me a Coffee
- AlgoWay vs PineConnector
- Compare AlgoWay with other trading automation tools
- AlgoWay Red News Filter
- Why Paid Trading Indicators Avoid Verifiable Backtests
- How Trade Automation Tools Mislead You
- utomating a Prop-Firm Eval End to End:
- ATP Premium Indicator Testing Bot
- Why TradingView Backtests Win but Live Trades Lose
- Best Prop Firms for Trading Automation and Telegram Signal Copy in 2026
- Four AIs, One Trader, and the Strange Case of TradingView to Alpaca
- TradingView Automation
AlgoWay Strategy Lab
Ulcer Index: Why Equal Maximum Drawdowns Feel Different
Published November 7, 2026 · View Markdown
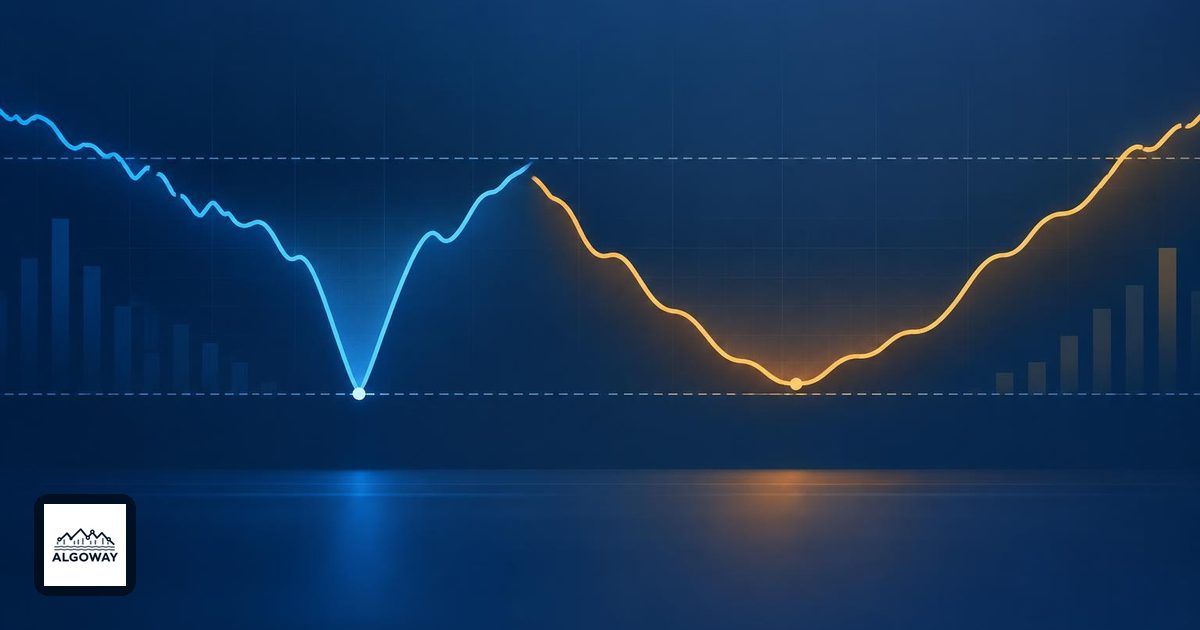
A quick fall and recovery can share the same maximum drawdown as a decline that sits underwater for several bars. The deepest point is identical. The experience between the peak and the recovery is not.
The Ulcer Index distinguishes those paths by averaging squared percentage drawdowns and taking the square root. It describes the depth and persistence of the observed decline, rather than reporting only the worst point.
That distinction matters when a TradingView automation rule uses drawdown as an entry filter. A rule based on the Ulcer Index can remain restrictive after price has recovered because older drawdown observations still occupy its window. In an AlgoWay alert-to-execution workflow, define that filter in the signal rule before configuring the execution message. An order instruction alone does not explain which risk condition allowed it.
What gets squared
TradingView's Ulcer Index reference defines a rolling calculation: find the highest source value over the chosen length, measure each bar's percentage decline from its own rolling high, then calculate the root mean square of those drawdown observations over the length.
With Close as the source and length N, the calculation can be written:
H[t] = highest closing price across the N bars ending at t
D[t] = 100 * (Close[t] - H[t]) / H[t]
UI[t] = sqrt(mean of D[j]^2 across the N bars ending at t)
For positive prices, D is zero at the rolling high and negative below it. Squaring removes that sign. The resulting index is nonnegative and uses percentage-point units. A value of 4 is not a 4% probability of a loss and does not promise a maximum future loss of 4%.
StockCharts' explanation emphasizes why squaring matters: a 10% drawdown contributes 100 to the squared sum, while a 5% drawdown contributes 25. Twice the depth contributes four times as much before the final averaging and square root.
Same worst decline, different index
Here is a deliberately small example with N = 5. Assume each series had at least five earlier closes at 100, so every rolling high needed for the five observations below is 100. These are invented price sequences for arithmetic, not backtests.
| Bar | Quick recovery close | Its drawdown | Persistent decline close | Its drawdown |
|---|---|---|---|---|
| 1 | 100 | 0% | 100 | 0% |
| 2 | 90 | -10% | 90 | -10% |
| 3 | 100 | 0% | 90 | -10% |
| 4 | 100 | 0% | 90 | -10% |
| 5 | 100 | 0% | 100 | 0% |
Both paths fall from 100 to 90, so each has a 10% maximum drawdown. Both finish at 100. At bar 5, however:
- Quick recovery: sqrt((0 + 100 + 0 + 0 + 0) / 5) = sqrt(20), approximately 4.47.
- Persistent decline: sqrt((0 + 100 + 100 + 100 + 0) / 5) = sqrt(60), approximately 7.75.
The second path contributes three deeply underwater observations instead of one. Its index is higher even though the low and final price match. Notice that neither index is zero at the final recovery: reaching the high fixes today's drawdown, not the previous observations still in the average.
This also separates three questions. Current drawdown asks where price stands now. Maximum drawdown asks how deep the worst decline was. The Ulcer Index aggregates the drawdown observations. Our drawdown recovery calculation answers another question: how much price must gain from a loss to regain its peak.
A rolling high can forget an old peak
The two rolling operations deserve attention. Each drawdown observation uses the highest value in its own N-bar window. The final index then averages N of those squared observations. Calculating a fully populated result therefore needs enough preceding data for both stages, not just the last N displayed prices.
If price falls from 100 to 90 and stays at 90, the original high eventually leaves the rolling-high window. New drawdown observations can become zero even though price has never regained 100. After the older negative observations also leave the averaging window, the index can become zero. This follows from the rolling formula; it does not mean the original investor recovered the loss.
Do not substitute an all-time account-equity peak for the rolling price high and expect identical results. That may be a useful separate risk measure, but it uses a different definition. Record whether the input is market price, account equity or another series, and whether the reference peak expires.
Turn a risk reading into an explicit rule
Suppose a research rule allows a long entry only when UI is below 6. In the example, the quick-recovery path qualifies at bar 5 and the persistent path does not. The threshold is illustrative, not an optimized setting or a recommendation.
“Below 6” is a continuing state. “Crossed below 6 on this completed bar” is a one-time transition. If another condition creates the entry signal, decide whether UI merely permits that signal or creates an event itself. Also specify whether a failed filter blocks new entries only or closes an existing position. Those choices describe different strategies.
Match source, length and calculation timeframe before comparing readings. Five daily observations and five hourly observations describe different stretches of time. A price-based downside measure is also oriented toward long exposure: falling prices may benefit a short position, so the same index is not automatically a short strategy's loss measure.
Keep the indicator's historical description separate from the decision you test. Low observed drawdown does not supply an entry direction, set an order quantity or guarantee protection against the next gap. The useful automation specification is the complete condition, its evaluation time and its intended order action.