AlgoWay Blog
Guides, manuals and platform references.
Core
- All articles
- FAQ
- PineConnector alternative
- TradersPost alternative
- Automate TradingView alerts
- Automate Telegram signals
- AlgoWay CopyTrader
- cTrader Copier
- TrendSpider with AlgoWay
- How to Automate a TradingView Indicator with Dynamic SL/TP and 1% Risk on MT5
JSON & Alerts
- JSON schema
- Manual alerts
- TradingView without paid subscription
- AlgoWay Strategy Integration in Pine Script
- Python Trading Bot Webhook Integration
- TRALADAL - TradingView Alert Adapter
- TradingView Order Action Alert
- How to use Clone Mode
MT5 / Expert Advisors
Errors
Integrations
- MetaTrader 5
- Tradovate
- TradeLocker
- cTrader
- Match-Trader
- DXtrade
- Capital.Com
- Binance
- Bybit
- MEXC
- OKX
- Bitget
- Hyperliquid
- BingX
- Alpaca
- Interactive Brokers
- Gate.io
- Coinbase
- TooBit
- WEEX
- KuCoin
- Kraken
- ProjectX
- Rithmic
Other Publications
- MT5 EA Webhook JSON Reference
- OANDA MT5 with AlgoWay
- Buy Webhook via Buy Me a Coffee
- AlgoWay vs PineConnector
- Compare AlgoWay with other trading automation tools
- AlgoWay Red News Filter
- Why Paid Trading Indicators Avoid Verifiable Backtests
- How Trade Automation Tools Mislead You
- utomating a Prop-Firm Eval End to End:
- ATP Premium Indicator Testing Bot
- Why TradingView Backtests Win but Live Trades Lose
- Best Prop Firms for Trading Automation and Telegram Signal Copy in 2026
- Four AIs, One Trader, and the Strange Case of TradingView to Alpaca
- TradingView Automation
AlgoWay Strategy Lab
Sharpe vs Sortino: Why Trading Strategy Ranks Differ
Published
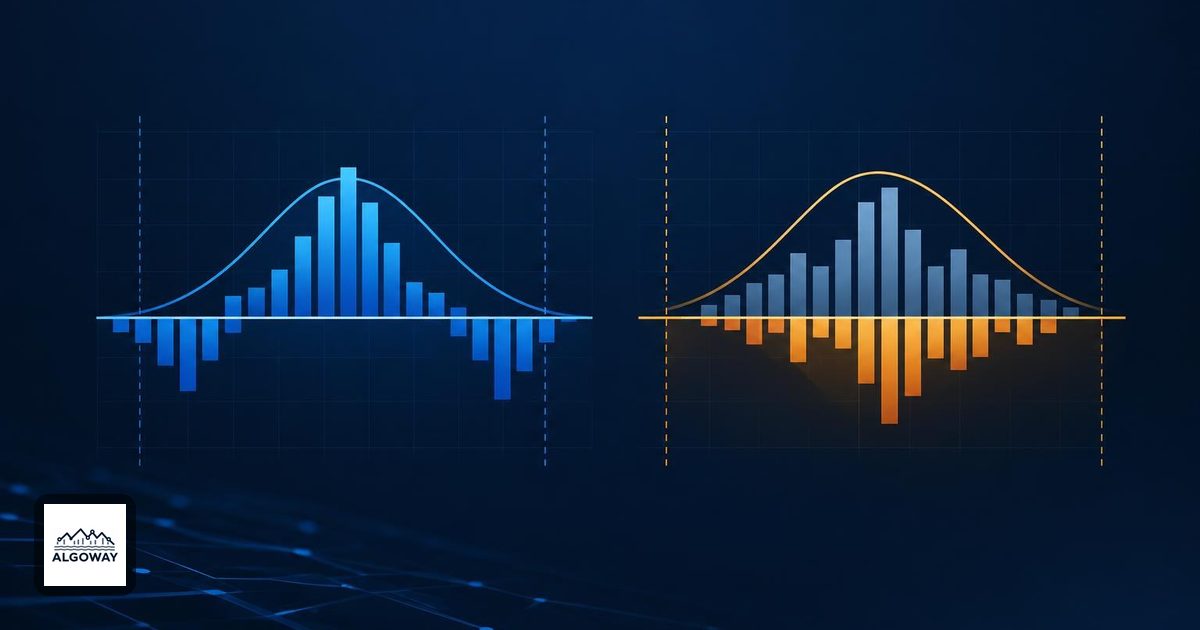
Two strategy reports can disagree about the winner without either calculator being broken. Sharpe measures return relative to overall variability. Sortino measures return above a chosen target relative to shortfalls below that target. A large winning period enters those denominators differently.
This matters when selecting an automated trading strategy. Before sending its signals through an execution workflow such as TradingView alerts routed by AlgoWay, ask what the ranking actually rewards. An execution connection does not supply the missing definition of risk in a performance report.
Define the return series before the ratio
The calculation note hosted by CME Group describes Sharpe as average return above the risk-free rate divided by return standard deviation. Use a risk-free return for the same observation period. With a constant benchmark, subtracting it leaves the standard deviation unchanged. Variability includes both positive and negative deviations from the mean.
For Sortino, the calculation note hosted by CME Group uses a target return T and target downside deviation. For each period, take the smaller of return minus T and zero, square it, average across all periods, then take the square root. Divide mean return minus T by that result. Periods meeting the target contribute zero to the squared shortfalls but remain in the observation count.
Use equally spaced account returns, such as monthly returns, for the example below. A list of dollar profits from trades of unequal size and duration is a different input. Keep account valuation, cash-flow treatment, fees and the observation calendar consistent when comparing real reports.
A four-period example that reverses the ranking
These are invented arithmetic examples, not backtests or investment results. Assume four monthly returns, already net of costs, a zero risk-free return and a zero Sortino target. Numbers in the calculations use percentage points. Sharpe uses sample standard deviation, dividing squared deviations by N − 1; Sortino uses all N periods in its downside average. Neither ratio is annualized.
| Measure | Strategy A | Strategy B |
|---|---|---|
| Monthly returns | −1%, +2%, +2%, +2% | −1%, 0%, 0%, +8% |
| Arithmetic mean | 1.25% | 1.75% |
| Sample standard deviation | 1.50 percentage points | 4.193 percentage points |
| Downside deviation, target 0% | 0.50 percentage points | 0.50 percentage points |
| Sharpe | 0.833 | 0.417 |
| Sortino | 2.50 | 3.50 |
For A, the deviations from its mean are −2.25, +0.75, +0.75 and +0.75. Their squared sum is 6.75, so sample standard deviation is √(6.75 / 3) = 1.50. For B, the squared deviations sum to 52.75, giving √(52.75 / 3) ≈ 4.193.
Both downside calculations contain just one nonzero squared shortfall: (−1)². Dividing by four and taking the square root gives 0.50. B's large positive month raises its mean but does not add a shortfall below zero. Sharpe ranks A higher; Sortino ranks B higher. That is a consequence of the definitions, not evidence that B is the better bot.
Dividing that single squared loss by one instead of four would give a downside deviation of 1.00 and halve both Sortino values. It would answer a different calculation question. Taking the standard deviation of the lone negative return is different again, and is undefined under a sample standard-deviation convention.
A positive return can fall below the target
Change only the monthly Sortino target to 1%. This is an illustrative threshold, not a recommended objective. A now has shortfalls of −2, 0, 0 and 0 percentage points. Its downside deviation is 1.00, and its Sortino is (1.25 − 1) / 1 = 0.25.
B has shortfalls of −2, −1, −1 and 0. Its downside deviation is √(6 / 4) ≈ 1.225, and its Sortino is (1.75 − 1) / 1.225 ≈ 0.612. The two flat months now count as misses. A month returning +0.5% would also miss this target despite making money.
Record the target alongside the score. A “Sortino 3.5” label without its target and sampling period is rather like a temperature without the scale: the number is intact, but the meaning has wandered off.
Read what the score leaves out
Neither calculation above uses the order of the four returns. Rearranging them leaves these ratios unchanged, even though the equity path changes. Compare that with the path-sensitive drawdown discussion in recovery factor versus profit factor.
Before using a ratio to rank automation candidates, retain the return series, sample length, benchmark, target, standard-deviation convention and any annualization method. Compare the same dates and cost basis. If there are no shortfalls, the Sortino denominator is zero; a blank or infinite display is not evidence of unlimited safety.
Finally, examine where the returns came from. In B, one period supplies every positive return. Four observations cannot establish that such a gain will recur. Keep that concentration visible when reviewing the limits of small performance samples, then assess the strategy on data that did not select its settings.