AlgoWay Blog
Guides, manuals and platform references.
Core
- All articles
- FAQ
- PineConnector alternative
- TradersPost alternative
- Automate TradingView alerts
- Automate Telegram signals
- AlgoWay CopyTrader
- cTrader Copier
- TrendSpider with AlgoWay
- How to Automate a TradingView Indicator with Dynamic SL/TP and 1% Risk on MT5
JSON & Alerts
- JSON schema
- Manual alerts
- TradingView without paid subscription
- AlgoWay Strategy Integration in Pine Script
- Python Trading Bot Webhook Integration
- TRALADAL - TradingView Alert Adapter
- TradingView Order Action Alert
- How to use Clone Mode
MT5 / Expert Advisors
Errors
Integrations
- MetaTrader 5
- Tradovate
- TradeLocker
- cTrader
- Match-Trader
- DXtrade
- Capital.Com
- Binance
- Bybit
- MEXC
- OKX
- Bitget
- Hyperliquid
- BingX
- Alpaca
- Interactive Brokers
- Gate.io
- Coinbase
- TooBit
- WEEX
- KuCoin
- Kraken
- ProjectX
- Rithmic
Other Publications
- MT5 EA Webhook JSON Reference
- OANDA MT5 with AlgoWay
- Buy Webhook via Buy Me a Coffee
- AlgoWay vs PineConnector
- Compare AlgoWay with other trading automation tools
- AlgoWay Red News Filter
- Why Paid Trading Indicators Avoid Verifiable Backtests
- How Trade Automation Tools Mislead You
- utomating a Prop-Firm Eval End to End:
- ATP Premium Indicator Testing Bot
- Why TradingView Backtests Win but Live Trades Lose
- Best Prop Firms for Trading Automation and Telegram Signal Copy in 2026
- Four AIs, One Trader, and the Strange Case of TradingView to Alpaca
- TradingView Automation
AlgoWay Strategy Lab
Pine Source Inputs: Why Chart Drawings Are Not Signals
Published November 21, 2026 · View Markdown
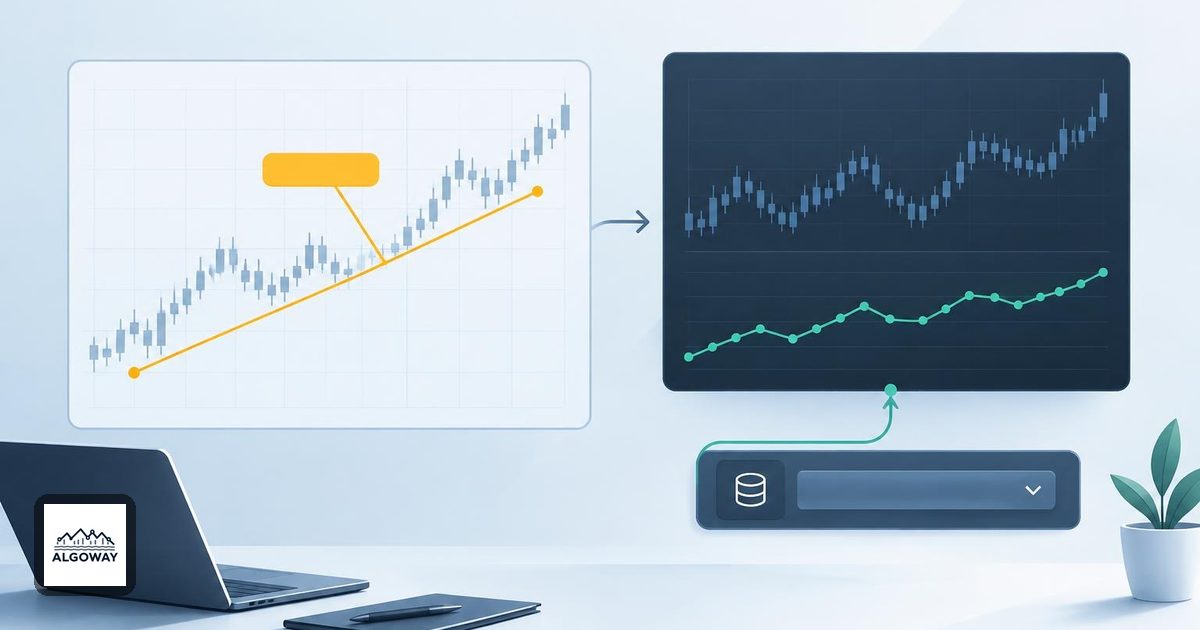
A chart can show a convincing BUY label while a second script's source selector offers nothing useful to select. The label is visible to you. That does not establish that its author exposed a numeric series for another script to read.
This matters before TradingView alert automation: first establish what data crosses from the indicator into the receiving script, then define the event that may become an order. When using AlgoWay's TradingView alert adapter workflow, source eligibility belongs before comparator and execution settings. Changing an order message cannot repair a missing indicator input.
A source selector is a data connection
Pine's input.source() can select standard price series or values plotted by another script on the chart. TradingView demonstrates this by feeding an indicator's plotted moving average into another indicator in its source-input documentation.
A numeric plot supplies a value for each bar, potentially including missing values. A drawing is a different object. Pine's line and box tools use drawing IDs and coordinates; labels and tables are also objects. They are not interchangeable with a numeric plot merely because both appear on the same chart. See TradingView's drawing-object documentation.
For example, an author could draw a support line from two selected points, or plot a support-price series calculated for every bar. Both may look like a line. Only the appearance is the same; the receiving script needs an eligible plotted output. A label saying BUY may likewise have a companion signal plot, but the label alone does not promise one.
Visible is not the same as available
There is a useful reverse case: an invisible plot can still be a source. TradingView documents plot(..., display = display.none) for values intended as external inputs. That setting hides the plot from the pane, status line and Data Window while retaining its calculated values. Plot titles appear in source-input selectors. See the plot parameter reference.
| What you observe | What to establish next |
|---|---|
| A BUY label or drawn trend line | Does the author also expose a numeric plot for the condition or level? |
| A selectable plot with no visible line | Is it intentionally hidden, and what do its values mean? |
| A plot named Signal | Does it encode an event, a persistent state, or a price? |
| A value that is missing on most bars | Does missing mean no event, unavailable data, or warm-up? |
Do not infer an encoding from a color or a title. Ask for the plot name, its numeric contract and the bar on which the value becomes usable. For a protected indicator, that may require the author's documentation or an exposed output; source selection does not grant access to its private calculations.
The producing script also matters
TradingView's indicator FAQ states that external source plots must come from indicators, not strategies. A strategy can consume an indicator's plot, but that does not make a strategy's own output eligible as the producer.
The same FAQ warns that after removing and re-adding the receiving script, you must select the correct inputs again. Treat the selected indicator instance and plot as part of the configuration record, alongside symbol and timeframe. Two instances with different settings can have similar-looking names and different values.
Read values before writing a trading condition
Consider these hypothetical outputs. They are invented examples of possible encodings, not defaults promised by any indicator or adapter.
| Four successive values | Possible meaning | Consequence for an entry rule |
|---|---|---|
0, 1, 0, 0 | A one-bar event pulse | Equality to 1 identifies one event bar |
0, 1, 1, 1 | A persistent bullish state | Equality to 1 remains true for three bars |
na, 102.5, na, na | A price published only at an event | Comparing the value with 1 does not identify this event |
In the second row, a transition from 0 to 1 and a test for “currently 1” answer different questions. One notices a change; the other notices a condition that continues to hold. Neither is automatically the intended trading instruction. In the third row, the author must explain what the price represents and what missing values mean.
Record a few known signal bars and neighboring non-signal bars. Inspect the selected series through a diagnostic display if necessary, then write down the expected numeric values and intended events. This isolates the data connection from the trading rule before a webhook is involved.
Availability does not prove timing or performance
A selectable source is only evidence that data can pass between scripts. It does not establish that a historical signal was available at the time shown, that an intrabar value will survive the close, or that the resulting strategy is profitable.
Choose when the receiving rule evaluates its inputs. For a source that uses higher-timeframe data, the higher-timeframe confirmation guide explains why a chart-bar-close rule may still be insufficient. Source eligibility and confirmation timing are separate checks.
Before connecting execution, your configuration record should identify the producer, plot title, value encoding, missing-value policy and event timing. A screenshot can help locate a marker. The numbers must explain why an alert should fire.