AlgoWay Blog
Guides, manuals and platform references.
Core
- All articles
- FAQ
- PineConnector alternative
- TradersPost alternative
- Automate TradingView alerts
- Automate Telegram signals
- AlgoWay CopyTrader
- cTrader Copier
- TrendSpider with AlgoWay
- How to Automate a TradingView Indicator with Dynamic SL/TP and 1% Risk on MT5
JSON & Alerts
- JSON schema
- Manual alerts
- TradingView without paid subscription
- AlgoWay Strategy Integration in Pine Script
- Python Trading Bot Webhook Integration
- TRALADAL - TradingView Alert Adapter
- TradingView Order Action Alert
- How to use Clone Mode
MT5 / Expert Advisors
Errors
Integrations
- MetaTrader 5
- Tradovate
- TradeLocker
- cTrader
- Match-Trader
- DXtrade
- Capital.Com
- Binance
- Bybit
- MEXC
- OKX
- Bitget
- Hyperliquid
- BingX
- Alpaca
- Interactive Brokers
- Gate.io
- Coinbase
- TooBit
- WEEX
- KuCoin
- Kraken
- ProjectX
- Rithmic
Other Publications
- MT5 EA Webhook JSON Reference
- OANDA MT5 with AlgoWay
- Buy Webhook via Buy Me a Coffee
- AlgoWay vs PineConnector
- Compare AlgoWay with other trading automation tools
- AlgoWay Red News Filter
- Why Paid Trading Indicators Avoid Verifiable Backtests
- How Trade Automation Tools Mislead You
- utomating a Prop-Firm Eval End to End:
- ATP Premium Indicator Testing Bot
- Why TradingView Backtests Win but Live Trades Lose
- Best Prop Firms for Trading Automation and Telegram Signal Copy in 2026
- Four AIs, One Trader, and the Strange Case of TradingView to Alpaca
- TradingView Automation
AlgoWay Strategy Lab
MACD Histogram vs MACD Line: Two Different Zero Crosses
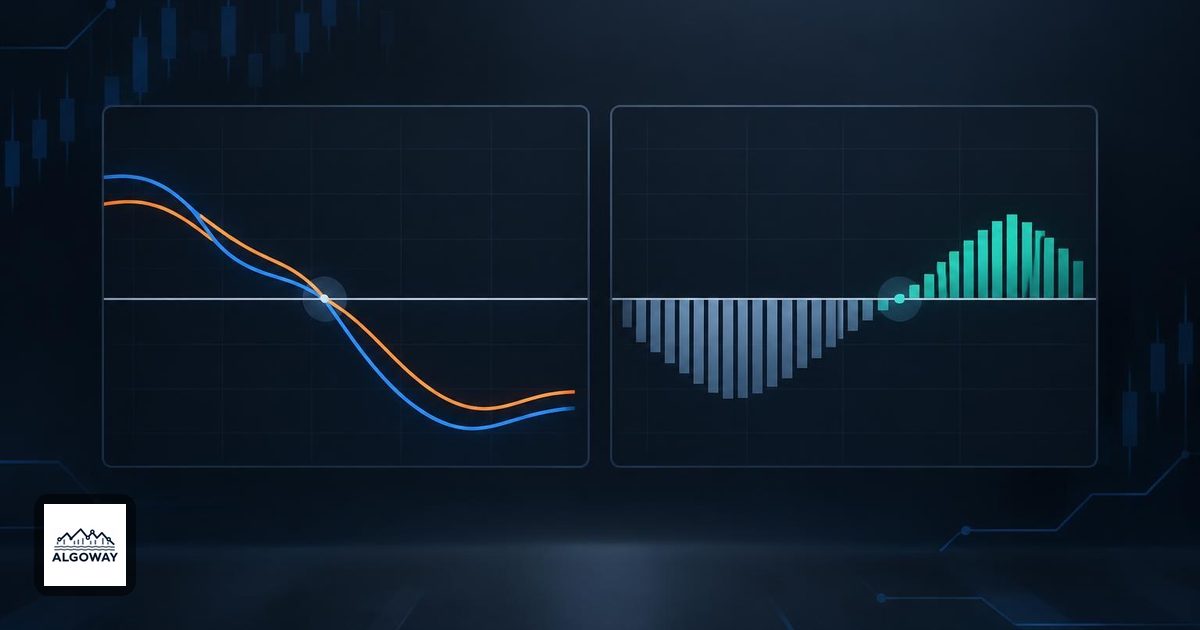
A MACD histogram can turn positive while the MACD line stays below zero. Nothing is broken. The histogram compares the MACD line with its signal line; the MACD line compares a fast price average with a slow one. Those are different races with different finishing lines.
For TradingView automation, that distinction decides which event becomes an order instruction. Before using AlgoWay to automate TradingView alerts, write down whether your rule means a histogram crossing or a MACD-line crossing. A message called “MACD buy” leaves the most important part unsaid.
What each zero actually measures
TradingView defines MACD as the fast moving average minus the slow moving average. Its signal line is a moving average of MACD, and its histogram is MACD minus that signal line. The indicator allows choices for the oscillator and signal moving-average types. See the official MACD calculation and settings.
- MACD above zero: the fast price average exceeds the slow price average.
- Histogram above zero: MACD exceeds its signal line, even if both lines are negative.
- Histogram equal to zero: MACD and the signal line are equal. This does not require either line to equal zero.
These relationships describe the calculation. They do not establish that a particular entry will make money.
A positive histogram underneath a negative MACD
Consider these invented values, chosen to make the subtraction easy. They are an arithmetic illustration, not observed trades or a backtest.
| Observation | MACD | Signal | Histogram |
|---|---|---|---|
| Previous bar | -2.0 | -1.5 | -0.5 |
| Current bar | -1.0 | -1.4 | +0.4 |
The histogram changes sign because -1.0 is greater than -1.4. MACD has crossed above its signal line, but it has not crossed above zero. On the current bar, the fast price average is still one price unit below the slow average.
The reverse combination is possible too: MACD at +2.0 and signal at +2.5 produce a histogram of -0.5. A negative histogram does not, by itself, mean the fast price average is below the slow one.
Choose the event before choosing the alert
TradingView's documented MACD Strategy takes long entries on negative-to-positive histogram changes and switches short on positive-to-negative changes. That is a histogram-sign strategy. Reading it as a MACD-line-zero strategy would describe a different set of entries.
For your own rule, specify the series and the comparison explicitly:
- Histogram upward crossing: previous histogram is at or below zero and current histogram is above zero.
- MACD upward crossing: previous MACD is at or below zero and current MACD is above zero.
- Combined rule: histogram crosses upward while MACD is above zero.
The third rule is an extra filter, not another name for either of the first two. In the worked example it rejects the histogram crossing. If MACD turns positive later but the histogram stays positive, the combined rule still has no fresh histogram crossing. This is a common source of “missing” signals: the rule asked for two conditions on the same bar.
A histogram that rises from -0.8 to -0.2 has improved, but remains negative. Likewise, a fall from +0.8 to +0.2 is not a downward zero crossing. Define the numeric event instead of relying on a color or the word “rising.”
Make the test and the running alert agree
Record the source, chart and calculation timeframes, fast and slow lengths, signal length, and average types. Then decide whether the condition must survive bar close. TradingView's Pine alert documentation explains that realtime values can change during a bar and that a running alert uses a saved copy of its script and inputs. After changing the rule, replace the alert that retained the old settings.
Review a few events numerically: previous MACD, previous signal, current MACD, current signal, and the resulting histogram. Confirm which comparison fired before examining execution. A correctly delivered alert can still carry the wrong trading idea.
Once the event is unambiguous, evaluate its costs and exits separately. The moving-average whipsaw guide explains why a clean crossing can still be a poor trade in a sideways market. A precise rule is a useful starting point; it is not a profit certificate.