AlgoWay Blog
Guides, manuals and platform references.
Core
- All articles
- FAQ
- PineConnector alternative
- TradersPost alternative
- Automate TradingView alerts
- Automate Telegram signals
- AlgoWay CopyTrader
- cTrader Copier
- TrendSpider with AlgoWay
- How to Automate a TradingView Indicator with Dynamic SL/TP and 1% Risk on MT5
JSON & Alerts
- JSON schema
- Manual alerts
- TradingView without paid subscription
- AlgoWay Strategy Integration in Pine Script
- Python Trading Bot Webhook Integration
- TRALADAL - TradingView Alert Adapter
- TradingView Order Action Alert
- How to use Clone Mode
MT5 / Expert Advisors
Errors
Integrations
- MetaTrader 5
- Tradovate
- TradeLocker
- cTrader
- Match-Trader
- DXtrade
- Capital.Com
- Binance
- Bybit
- MEXC
- OKX
- Bitget
- Hyperliquid
- BingX
- Alpaca
- Interactive Brokers
- Gate.io
- Coinbase
- TooBit
- WEEX
- KuCoin
- Kraken
- ProjectX
- Rithmic
Other Publications
- MT5 EA Webhook JSON Reference
- OANDA MT5 with AlgoWay
- Buy Webhook via Buy Me a Coffee
- AlgoWay vs PineConnector
- Compare AlgoWay with other trading automation tools
- AlgoWay Red News Filter
- Why Paid Trading Indicators Avoid Verifiable Backtests
- How Trade Automation Tools Mislead You
- utomating a Prop-Firm Eval End to End:
- ATP Premium Indicator Testing Bot
- Why TradingView Backtests Win but Live Trades Lose
- Best Prop Firms for Trading Automation and Telegram Signal Copy in 2026
- Four AIs, One Trader, and the Strange Case of TradingView to Alpaca
- TradingView Automation
AlgoWay Strategy Lab
Chaikin Money Flow: Why It Can Rise After a Gap Down
Published 2026-11-06 · Author: AlgoWay
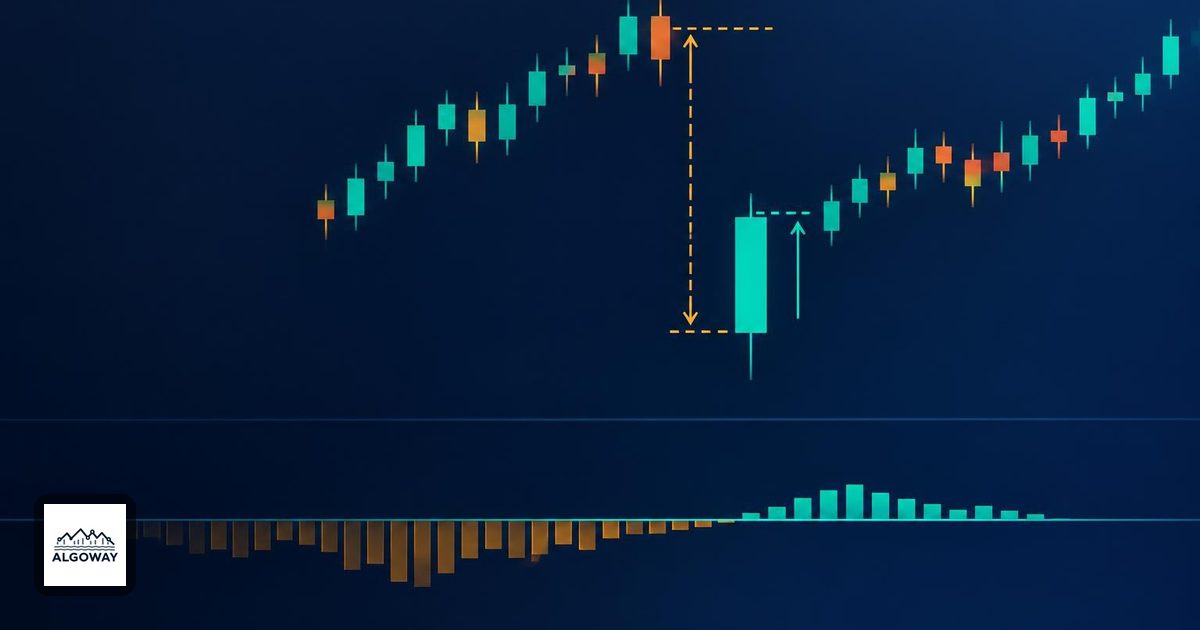
Yesterday's close was 100. Today the market opens at 90, trades between 88 and 94, and closes at 93. The price damage is obvious. Yet that candle contributes positively to Chaikin Money Flow because it closed near the top of its own range.
CMF measures the close's location inside each bar, weighted by volume. It does not use the previous close in that bar's money-flow multiplier. For TradingView alert automation, a rule such as “CMF above zero” therefore does not mean “price recovered the gap.” When connecting a condition through an AlgoWay TradingView alert workflow, define the price requirement separately if recovering the gap is part of the intended entry.
What the multiplier actually compares
The standard calculation is:
multiplier = ((close - low) - (high - close)) / (high - low)
money-flow volume = multiplier × volume
CMF = sum of money-flow volume / sum of volume
Both sums cover the chosen lookback. Fidelity's CMF reference documents this calculation. The close is compared with the current high and low, not with the open or yesterday's close.
Using the illustrative gap-down bar:
- Distance above the low:
93 - 88 = 5. - Distance below the high:
94 - 93 = 1. - Range:
94 - 88 = 6. - Multiplier:
(5 - 1) / 6 = 2/3, approximately 0.6667.
If its volume is 12,000, its money-flow volume is 8,000. These are invented inputs chosen to make the arithmetic visible. Positive money-flow volume does not erase the seven-point decline from the previous close of 100.
TradingView explicitly identifies price gaps as a limitation: the multiplier does not account for the shift in range between bars. A gap down followed by a strong close inside the new lower range can therefore disagree with the direction suggested by the indicator.
Positive contribution is not the same as positive CMF
The latest candle is only one part of the lookback. To see the difference, use a deliberately short three-bar window. Suppose every bar has volume 12,000, and the first two multipliers are both -0.25.
| Bar in the window | Multiplier | Volume | Money-flow volume |
|---|---|---|---|
| First | -0.25 | 12,000 | -3,000 |
| Second | -0.25 | 12,000 | -3,000 |
| Gap-down bar | 2/3 | 12,000 | 8,000 |
| Total | 36,000 | 2,000 |
CMF is 2,000 / 36,000, approximately +0.0556. The full window is positive even though the newest close is below the preceding close.
Now change the first two multipliers to -0.5, keeping the volumes and gap-down bar unchanged. Their contributions become -6,000 each. CMF becomes (-6,000 - 6,000 + 8,000) / 36,000, approximately -0.1111. The same positive latest contribution can coexist with a negative overall reading.
It can also make CMF rise. If the departing bar and the two retained bars all had multiplier -0.25 and equal volume, the previous window's CMF was -0.25. Replacing the departing bar with our gap-down bar produces +0.0556. The indicator rises while the latest closing price falls. The calculation is internally consistent; the interpretation needs narrower wording.
Decide what the alert should mean
These three conditions answer different questions:
| Condition | Question answered |
|---|---|
| Current CMF is above zero | Is the current volume-weighted window positive? |
| Previous CMF is at or below zero and current CMF is above zero | Did the window move into positive territory on this bar? |
| Current close exceeds the pre-gap close | Has price closed above that specific reference level? |
The first is a state, the second an event, and the third a price comparison. Combining the second and third would define a different rule from using the second alone. It would also exclude the 93-versus-100 example. That is a rule-design choice to evaluate, not evidence of improved returns.
Choose whether the rule uses completed bars and record the exact lookback, symbol, timeframe and reference level. For a gap-recovery condition that persists over several bars, retain the pre-gap reference; replacing it each bar with the immediately previous close changes the question.
Check the indicator's displayed scale before transferring a numeric threshold. TradingView describes a -1 to +1 scale, while Chaikin Analytics describes its display on a -100 to +100 scale. The same numeral should not be copied blindly between those displays.
For custom calculations, explicitly handle a bar whose high equals its low, because the raw multiplier would divide by zero. Also define what happens when the lookback's total volume is zero or unavailable. Do not invent a usable signal from an undefined ratio.
A volume indicator is not a cash-flow receipt
Chaikin Analytics notes that CMF uses price and volume activity rather than directly observing institutional order flow. A positive value is not proof that a particular group bought the gap or that a rebound must follow.
This also explains why CMF and On-Balance Volume need not tell the same story: their sign decisions use different price comparisons. Before treating either as confirmation, write down what it measures. In this example the accurate statement is “the close finished high within a lower range.” That statement fits both the chart and the arithmetic.