AlgoWay Blog
Guides, manuals and platform references.
Core
- All articles
- FAQ
- PineConnector alternative
- TradersPost alternative
- Automate TradingView alerts
- Automate Telegram signals
- AlgoWay CopyTrader
- cTrader Copier
- TrendSpider with AlgoWay
- How to Automate a TradingView Indicator with Dynamic SL/TP and 1% Risk on MT5
JSON & Alerts
- JSON schema
- Manual alerts
- TradingView without paid subscription
- AlgoWay Strategy Integration in Pine Script
- Python Trading Bot Webhook Integration
- TRALADAL - TradingView Alert Adapter
- TradingView Order Action Alert
- How to use Clone Mode
MT5 / Expert Advisors
Errors
Integrations
- MetaTrader 5
- Tradovate
- TradeLocker
- cTrader
- Match-Trader
- DXtrade
- Capital.Com
- Binance
- Bybit
- MEXC
- OKX
- Bitget
- Hyperliquid
- BingX
- Alpaca
- Interactive Brokers
- Gate.io
- Coinbase
- TooBit
- WEEX
- KuCoin
- Kraken
- ProjectX
- Rithmic
Other Publications
- MT5 EA Webhook JSON Reference
- OANDA MT5 with AlgoWay
- Buy Webhook via Buy Me a Coffee
- AlgoWay vs PineConnector
- Compare AlgoWay with other trading automation tools
- AlgoWay Red News Filter
- Why Paid Trading Indicators Avoid Verifiable Backtests
- How Trade Automation Tools Mislead You
- utomating a Prop-Firm Eval End to End:
- ATP Premium Indicator Testing Bot
- Why TradingView Backtests Win but Live Trades Lose
- Best Prop Firms for Trading Automation and Telegram Signal Copy in 2026
- Four AIs, One Trader, and the Strange Case of TradingView to Alpaca
- TradingView Automation
AlgoWay Strategy Lab
OBV Indicator: Why High Volume Can Leave It Unchanged
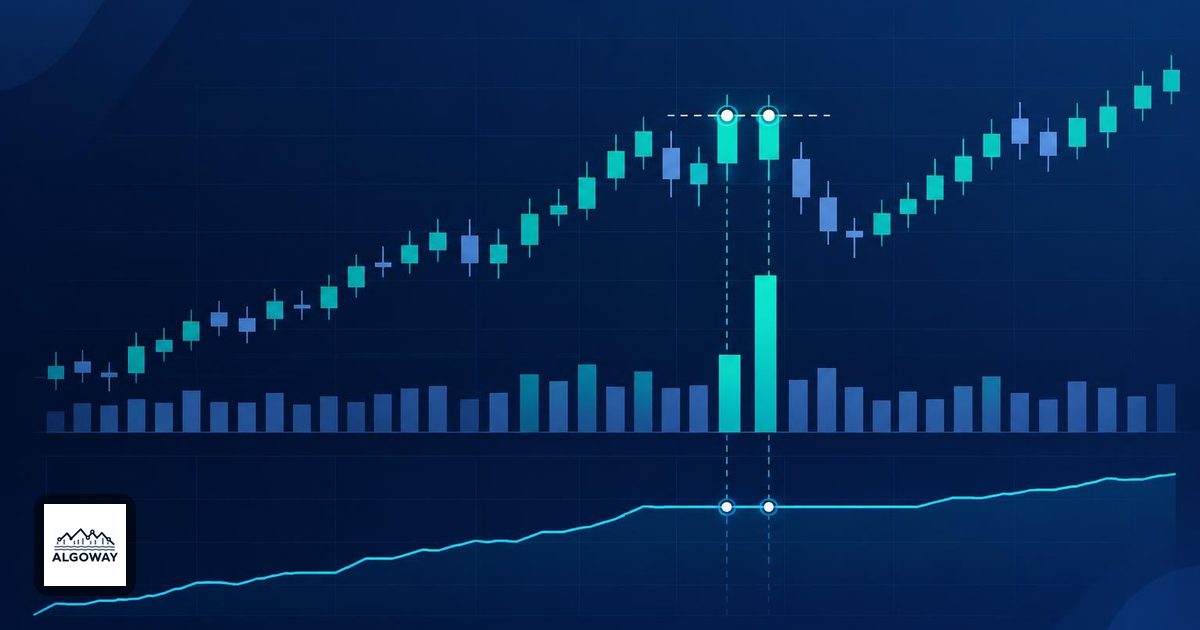
A very busy bar can leave On Balance Volume perfectly still. If its closing price equals the previous bar's close, the standard OBV calculation adds nothing and subtracts nothing. The volume has not vanished from the market. It simply contributes zero to this particular indicator.
That distinction matters in TradingView automation. A rule that requires OBV to rise will reject that bar, even if its volume is the largest on the screen. Before using AlgoWay to route TradingView alerts, decide whether the signal requires rising OBV, unusually high volume, or both. Those are separate conditions.
The comparison is close against previous close
TradingView's OBV reference defines three cases: add the current bar's volume when its close is higher than the preceding close, subtract it when lower, and leave the cumulative value unchanged when the closes match. ICE's OBV calculation reference documents the same unchanged-close treatment.
The bar's opening price does not decide the sign. Neither does the distance between its high and low. A green candle can therefore reduce OBV: suppose it opens at 98 and closes at 99, while the previous close was 100. Price rose inside the candle, but fell between the two closes. OBV subtracts that candle's volume.
A large volume bar with a zero contribution
The following numbers are invented solely to demonstrate the arithmetic. Start with an OBV value of 10,000 and a previous closing price of 100.
| Bar | Close | Volume | OBV change | New OBV |
|---|---|---|---|---|
| A | 101 | 2,000 | +2,000 | 12,000 |
| B | 101 | 9,000 | 0 | 12,000 |
| C | 100.99 | 500 | -500 | 11,500 |
| D | 101 | 800 | +800 | 12,300 |
Bar B has more volume than the other three bars combined, yet contributes nothing. Bar C moves only 0.01 lower, but its entire 500 units are subtracted. OBV weights the contribution by volume, not by the size of the price change. It is a sign-based running total, not a ledger that measures the price impact of every transaction.
Notice another consequence: B and D both close at 101 but have different OBV values. The accumulated path between observations matters. Comparing isolated OBV numbers without their price and volume history can answer a question nobody meant to ask.
A flat OBV line does not prove an inactive market
In this example, “OBV did not increase” is accurate. “There was no trading interest” does not follow. The formula deliberately discards the contribution of equal-close bars. Nor does it directly identify which individual trades were buyer-initiated or seller-initiated; its input here is the bar's total volume and the direction of the close change.
If the intended rule is “trade only when activity exceeds a threshold,” test volume itself against an explicitly chosen benchmark. If the intended rule is “require positive signed-volume accumulation,” OBV may express that rule. Changing one into the other changes the strategy, even if both charts look like volume indicators.
A similar reading mistake occurs when ROC rises while the latest price stays flat. In ROC, the older comparison price can change. In OBV, the equal-close branch contributes zero. The remedy in both cases is to inspect the inputs, but the arithmetic is different.
Define the event before creating the alert
Three plausible OBV rules have different meanings:
- OBV is higher than on the previous bar. This checks one signed-volume increment. A flat OBV bar fails the strict greater-than comparison.
- OBV exceeds the highest value in the previous 20 completed bars. This tests a cumulative breakout against earlier observations. Specify that the comparison window excludes the current bar.
- Volume exceeds a chosen benchmark and OBV rises. This requires two independent conditions. High volume alone cannot satisfy it.
These are rule definitions, not tested recommendations. Each still needs an entry event, exit logic, sizing and an evaluation period before it becomes a complete trading strategy.
Also specify when the rule is evaluated. TradingView's bar-state documentation explains that indicators update during a realtime bar and that barstate.isconfirmed becomes true on its closing update. An unfinished bar can move above, below and back to the previous close. A final flat OBV reading does not prove an earlier intrabar condition never occurred.
For a completed-bar design, require confirmation in the signal logic and use a compatible bar-close alert configuration. Keep the symbol, timeframe, source data and rule version with the test record. Then check the alert's actual message and the resulting order separately: a correctly calculated indicator is only the beginning of an automated trade.