AlgoWay Blog
Guides, manuals and platform references.
Core
- All articles
- FAQ
- PineConnector alternative
- TradersPost alternative
- Automate TradingView alerts
- Automate Telegram signals
- AlgoWay CopyTrader
- cTrader Copier
- TrendSpider with AlgoWay
- How to Automate a TradingView Indicator with Dynamic SL/TP and 1% Risk on MT5
JSON & Alerts
- JSON schema
- Manual alerts
- TradingView without paid subscription
- AlgoWay Strategy Integration in Pine Script
- Python Trading Bot Webhook Integration
- TRALADAL - TradingView Alert Adapter
- TradingView Order Action Alert
- How to use Clone Mode
MT5 / Expert Advisors
Errors
Integrations
- MetaTrader 5
- Tradovate
- TradeLocker
- cTrader
- Match-Trader
- DXtrade
- Capital.Com
- Binance
- Bybit
- MEXC
- OKX
- Bitget
- Hyperliquid
- BingX
- Alpaca
- Interactive Brokers
- Gate.io
- Coinbase
- TooBit
- WEEX
- KuCoin
- Kraken
- ProjectX
- Rithmic
Other Publications
- MT5 EA Webhook JSON Reference
- OANDA MT5 with AlgoWay
- Buy Webhook via Buy Me a Coffee
- AlgoWay vs PineConnector
- Compare AlgoWay with other trading automation tools
- AlgoWay Red News Filter
- Why Paid Trading Indicators Avoid Verifiable Backtests
- How Trade Automation Tools Mislead You
- utomating a Prop-Firm Eval End to End:
- ATP Premium Indicator Testing Bot
- Why TradingView Backtests Win but Live Trades Lose
- Best Prop Firms for Trading Automation and Telegram Signal Copy in 2026
- Four AIs, One Trader, and the Strange Case of TradingView to Alpaca
- TradingView Automation
AlgoWay Strategy Lab
CCI Indicator Explained: Mean Deviation and the 100 Level
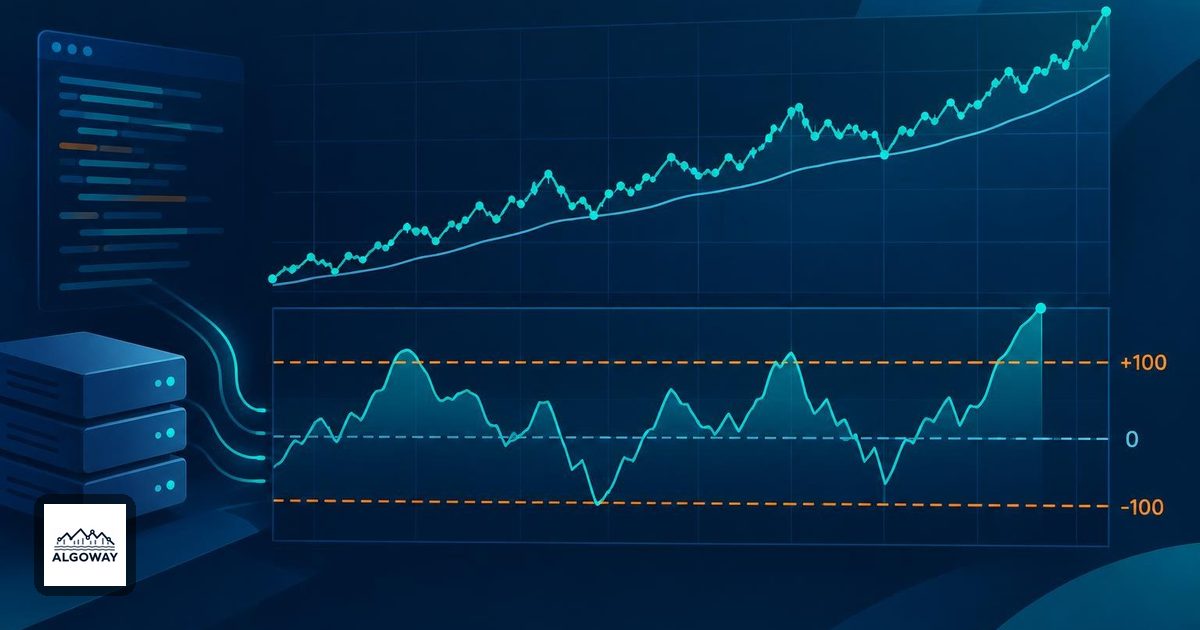
A CCI reading of 150 is not a broken gauge. The familiar +100 line is a reference level, not the top of the instrument. The Commodity Channel Index compares the current price with a recent average, then scales that distance by the window's mean absolute deviation.
That distinction matters in TradingView automation. “Buy above +100” and “sell after falling back below +100” turn the same indicator into different trading rules. For an AlgoWay workflow, settle that signal definition before preparing the execution message; the indicator-to-strategy guide helps separate the chart condition from the order workflow.
What goes into the number
The conventional calculation uses typical price: (high + low + close) / 3. For a window of N bars, calculate the average of those prices. Then measure each price's absolute distance from that same current window average and average those distances. This is mean absolute deviation, not standard deviation. The formula is:
CCI = (current typical price - window average)
      / (0.015 × mean absolute deviation)
See Fidelity's indicator reference for the conventional formula. Do not silently substitute an average of deviations calculated against a different rolling mean on every bar; that is a different calculation.
Check the actual indicator's source setting before comparing platforms. TradingView's CCI documentation presents the typical-price formula but also describes a configurable Source input. Matching the name “CCI” alone does not establish matching inputs.
A five-bar example you can check by hand
Take five hypothetical typical prices: 98, 99, 100, 101 and 107, with 107 the latest. Five bars keep the arithmetic readable; this is not a recommended trading setting.
- The average is 505 / 5 = 101.
- The absolute distances from 101 are 3, 2, 1, 0 and 6.
- Mean absolute deviation is 12 / 5 = 2.4.
- The current distance is 107 - 101 = 6.
- CCI is 6 / (0.015 × 2.4), or approximately 166.67.
The price is six units above its average, but CCI is not six units, six percent or 166.67 percent. It is a scaled ratio. Multiply every example price by ten and both the numerator and the deviation multiply by ten. CCI stays the same. Add 500 to every price and their distances from the average stay the same too.
Those two checks are useful when auditing a spreadsheet or an independently written indicator. A pure rescaling of all input prices should not change this calculation. If all prices in the window are identical, the denominator is zero; check how the implementation handles that case instead of treating division by zero as a valid signal.
Why 100 is a threshold, not a probability
The 0.015 factor sets the scale. Algebraically, CCI reaches +100 when the current price is 1.5 mean deviations above the window average, and -100 at 1.5 mean deviations below it. A reading of +200 corresponds to three mean deviations. None of these numbers is a probability of reversal.
TradingView notes that extreme readings can accompany trend continuation as well as reversal setups. Do not turn an “overbought” label into an unconditional sell order. Unlike the familiar bounded RSI scale, CCI has no fixed universal ceiling at +100 or floor at -100. For the separate RSI interpretation, see RSI thresholds and trading rules.
Write the event before automating it
Consider these invented sequences of completed-bar CCI readings:
- 80, 110, 140: a crossing above +100 happens at 110. A condition that merely checks “above +100” is also true at 140.
- 140, 110, 90: a crossing back below +100 happens at 90. This is a different event from the first sequence.
- -140, -110, -90: a crossing back above -100 happens at -90. The sign and crossing direction both matter.
Choose one event, specify the source and lookback, and decide whether you evaluate completed bars. Then define what an existing position should do when another event arrives. A threshold supplies a condition; it does not supply position size, a protective exit or evidence of profitability. Test those decisions together, with costs, before allowing the condition to send live orders.