AlgoWay Blog
Guides, manuals and platform references.
Core
- All articles
- FAQ
- PineConnector alternative
- TradersPost alternative
- Automate TradingView alerts
- Automate Telegram signals
- AlgoWay CopyTrader
- cTrader Copier
- TrendSpider with AlgoWay
- How to Automate a TradingView Indicator with Dynamic SL/TP and 1% Risk on MT5
JSON & Alerts
- JSON schema
- Manual alerts
- TradingView without paid subscription
- AlgoWay Strategy Integration in Pine Script
- Python Trading Bot Webhook Integration
- TRALADAL - TradingView Alert Adapter
- TradingView Order Action Alert
- How to use Clone Mode
MT5 / Expert Advisors
Errors
Integrations
- MetaTrader 5
- Tradovate
- TradeLocker
- cTrader
- Match-Trader
- DXtrade
- Capital.Com
- Binance
- Bybit
- MEXC
- OKX
- Bitget
- Hyperliquid
- BingX
- Alpaca
- Interactive Brokers
- Gate.io
- Coinbase
- TooBit
- WEEX
- KuCoin
- Kraken
- ProjectX
- Rithmic
Other Publications
- MT5 EA Webhook JSON Reference
- OANDA MT5 with AlgoWay
- Buy Webhook via Buy Me a Coffee
- AlgoWay vs PineConnector
- Compare AlgoWay with other trading automation tools
- AlgoWay Red News Filter
- Why Paid Trading Indicators Avoid Verifiable Backtests
- How Trade Automation Tools Mislead You
- utomating a Prop-Firm Eval End to End:
- ATP Premium Indicator Testing Bot
- Why TradingView Backtests Win but Live Trades Lose
- Best Prop Firms for Trading Automation and Telegram Signal Copy in 2026
- Four AIs, One Trader, and the Strange Case of TradingView to Alpaca
- TradingView Automation
AlgoWay Strategy Lab
Mass Index Reversal Bulge: Why Direction Is Separate
Published November 21, 2026 · View Markdown
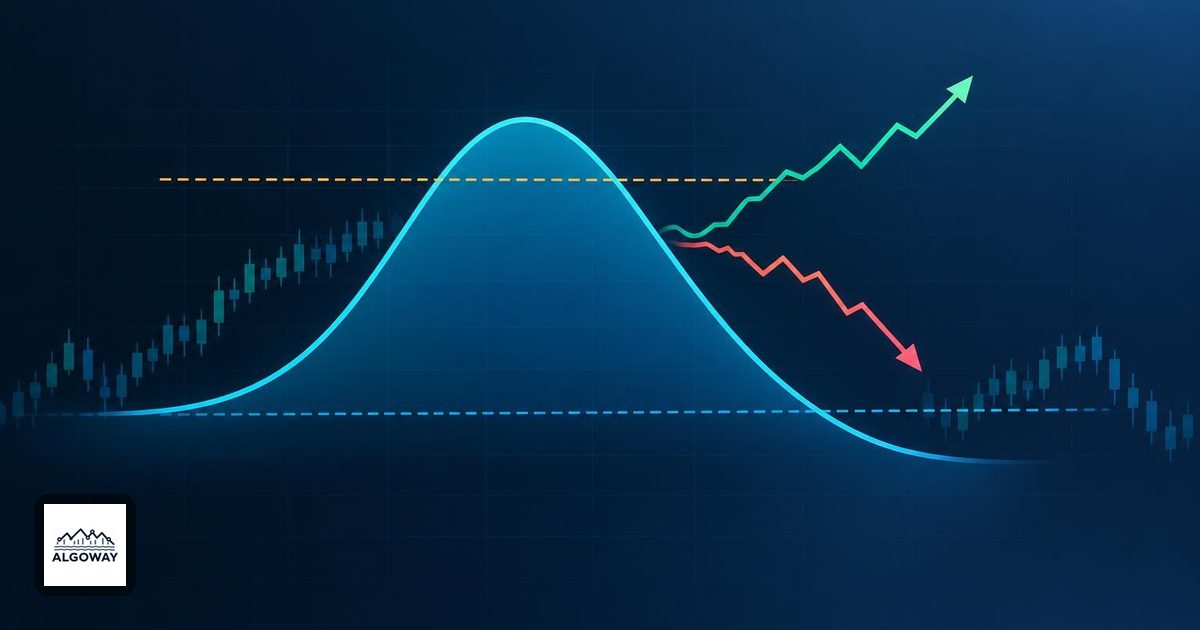
A Mass Index reading can tell the same story while price climbs or falls. Its input is the distance between each bar's high and low, so a reversal bulge does not carry a built-in buy or sell instruction.
For TradingView automation, there are three separate decisions: recognize the bulge, choose direction, and decide when the opportunity expires. Before following AlgoWay's TradingView alert adapter guide, write those decisions down. An adapter can work with exposed indicator values; it cannot supply a directional rule you have not defined.
What the number measures
The conventional calculation uses a nine-period EMA of high minus low, then another nine-period EMA of that first average. Divide the first average by the second and sum the latest 25 ratios. StockCharts documents this calculation and the reversal-bulge convention.
In compact notation: A = EMA(high - low, 9), B = EMA(A, 9), and Mass Index = sum(A / B, 25). These are periods of the chosen chart, not automatically calendar days. The ratio needs a valid, nonzero denominator.
Consider an arithmetic illustration, not a market test. If every ratio in a 25-bar window is 1, the sum is 25. If 20 ratios are 1 and five are 1.4, the sum is 27. The result describes the relationship between two smoothed range measures. It is neither a price target nor a 27% probability of reversal.
Imagine two invented price histories with identical high-low ranges on every bar but opposite paths through price. Given identical initialization, their range averages and Mass Index readings are identical. The indicator cannot recover direction from information it never received.
The bulge needs a memory
The classic sequence first exceeds 27 and later drops below 26.5. A reading below 26.5 by itself does not prove that sequence occurred. The cTrader Mass Index reference describes the two thresholds and explicitly separates the bulge from directional confirmation.
This hypothetical ledger shows one way to formalize that sequence. It uses strict thresholds and completed-bar values, and consumes a setup when the lower threshold is crossed.
| Bar | Mass Index | Recorded state | New bulge event? |
|---|---|---|---|
| 1 | 26.2 | Not armed | No: no prior setup |
| 2 | 27.2 | Armed | No: setup only |
| 3 | 26.8 | Still armed | No |
| 4 | 26.4 | Consumed | Yes: below 26.5 after setup |
| 5 | 26.1 | Not armed | No: the same bulge is finished |
A rule that buys whenever the value is below 26.5 would behave differently on bars 1 and 5. It would also add a long-side assumption. Neither choice is implied by the indicator's name.
For a reproducible implementation, specify whether exactly 27 arms the setup, whether a new high reading restarts an expiry clock, and what happens if the system begins observing halfway through a bulge. The ledger above requires greater than 27, then less than 26.5; it makes no claim that these choices are optimal.
Direction is a second rule
cTrader's documentation gives price crossing a nine-day EMA after a bulge as an example of directional confirmation. That is an additional price rule, not a component of the Mass Index formula. On an intraday chart, a nine-bar EMA is not a nine-day EMA.
Suppose your experimental long rule requires a completed bulge and a later close crossing above a specified price average. Define whether that crossing must happen on the bulge bar or may happen within the next five bars. If it happens six bars later, the two versions disagree. That disagreement is a strategy-design choice, not an indicator malfunction.
Also decide whether the bulge permits one trade or several, whether an opposite signal cancels permission, and whether an existing position blocks a new entry. A confirmation filter can delay or remove trades; it does not certify that the remaining trades will win.
Check the event before connecting execution
Keep a small diagnostic record containing the chart symbol, timeframe, indicator settings, setup bar, completion bar, direction rule and expiry. Compare the intended events with the script's actual alerts. Do not count every below-threshold bar as a fresh setup unless that is deliberately the strategy.
The Bollinger squeeze guide covers a related but different question: low-volatility compression before a breakout. Mass Index instead compares smoothed high-low ranges and waits for a bulge sequence. Substituting one for the other changes the experiment.
Evaluate any complete entry-and-exit rule with costs and an independent evaluation period before allowing it to control orders. No backtest or performance result is claimed here. The useful deliverable is a rule whose second alert is as explainable as its first.