AlgoWay Blog
Guides, manuals and platform references.
Core
- All articles
- FAQ
- PineConnector alternative
- TradersPost alternative
- Automate TradingView alerts
- Automate Telegram signals
- AlgoWay CopyTrader
- cTrader Copier
- TrendSpider with AlgoWay
- How to Automate a TradingView Indicator with Dynamic SL/TP and 1% Risk on MT5
JSON & Alerts
- JSON schema
- Manual alerts
- TradingView without paid subscription
- AlgoWay Strategy Integration in Pine Script
- Python Trading Bot Webhook Integration
- TRALADAL - TradingView Alert Adapter
- TradingView Order Action Alert
- How to use Clone Mode
MT5 / Expert Advisors
Errors
Integrations
- MetaTrader 5
- Tradovate
- TradeLocker
- cTrader
- Match-Trader
- DXtrade
- Capital.Com
- Binance
- Bybit
- MEXC
- OKX
- Bitget
- Hyperliquid
- BingX
- Alpaca
- Interactive Brokers
- Gate.io
- Coinbase
- TooBit
- WEEX
- KuCoin
- Kraken
- ProjectX
- Rithmic
Other Publications
- MT5 EA Webhook JSON Reference
- OANDA MT5 with AlgoWay
- Buy Webhook via Buy Me a Coffee
- AlgoWay vs PineConnector
- Compare AlgoWay with other trading automation tools
- AlgoWay Red News Filter
- Why Paid Trading Indicators Avoid Verifiable Backtests
- How Trade Automation Tools Mislead You
- utomating a Prop-Firm Eval End to End:
- ATP Premium Indicator Testing Bot
- Why TradingView Backtests Win but Live Trades Lose
- Best Prop Firms for Trading Automation and Telegram Signal Copy in 2026
- Four AIs, One Trader, and the Strange Case of TradingView to Alpaca
- TradingView Automation
AlgoWay Strategy Lab
Choppiness Index: Calculate and Use a Trend Filter
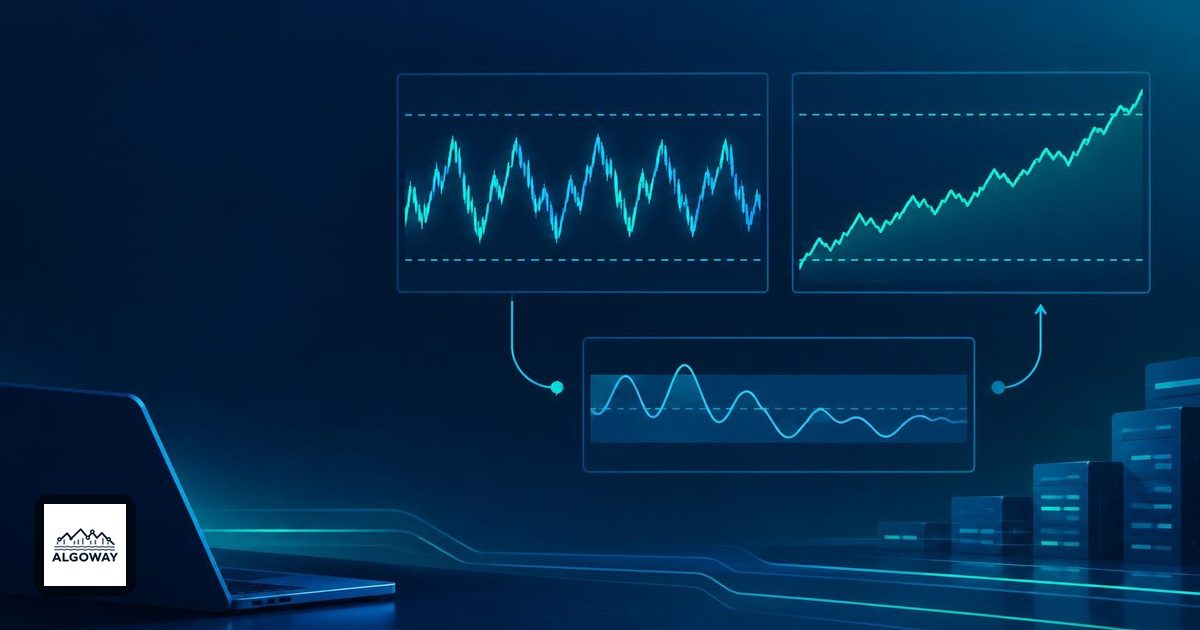
A market can travel a long distance without getting very far. The Choppiness Index compares accumulated true range with the high-to-low span of a lookback window. Repeated movement inside a confined range raises the ratio; a more direct journey produces a smaller one.
For TradingView automation, CHOP can be a permission rule: allow a separately defined entry only when the market meets your chosen condition. It supplies neither buy nor sell direction. In an AlgoWay alert-execution workflow, define that filter before the alert is sent, so the execution instruction represents the complete strategy decision.
What the calculation actually compares
TradingView documents CHOP as 100 × log10(S / R) / log10(n), where S is the sum of one-period ATR over n bars and R is the highest high minus the lowest low in that window. Its default length is 14. Higher readings describe more choppiness; lower readings describe stronger directional movement, without identifying its direction.
Use a length greater than one and a positive range for this expression. A flat window with a zero denominator needs explicit handling in custom code; it is not a usable entry signal. Also, accumulated true range is not the sum of close-to-close changes. Calling it “distance travelled” is an analogy, not a replacement formula.
Same range, different amounts of movement
Consider two invented 14-bar windows. Each has a highest high of 110 and a lowest low of 100, so R is 10 price units. Suppose their accumulated one-period ATR values are 20 and 60 respectively:
| Window | S / R | Calculation | CHOP, rounded |
|---|---|---|---|
| A: less accumulated movement | 20 / 10 = 2 | 100 × log10(2) / log10(14) | 26.3 |
| B: more accumulated movement | 60 / 10 = 6 | 100 × log10(6) / log10(14) | 67.9 |
These are arithmetic examples, not measured market windows or trading results. The second reading is higher because the numerator grew while the enclosing range stayed fixed. Neither row tells us whether the last close was above the first. Buying solely because the first row has a low reading would add a directional claim that the calculation never made.
Another useful thought experiment is to multiply every price and every price distance by ten. Both S and R become ten times larger, their ratio stays unchanged, and CHOP stays unchanged. This explains why the output is not a stop distance in points or a cash-risk estimate. A small CHOP reading does not mean a small monetary risk.
A threshold crossing and an entry filter are different rules
TradingView lists 38.2 and 61.8 as common lower and upper reference levels. They are conventions, not probabilities or guaranteed turning points. “CHOP below 38.2” describes a state; “CHOP crosses below 38.2” describes a transition.
Suppose an independently defined long breakout occurs on bar three of this hypothetical sequence:
- Bar one: CHOP closes at 42.
- Bar two: CHOP closes at 36.
- Bar three: CHOP closes at 34 and the long breakout condition becomes true.
A rule requiring CHOP to be below 38.2 permits that bar-three entry. A rule requiring a fresh crossing below 38.2 on the same bar does not: the crossing happened on bar two. Both rules are coherent, but they produce different signals. Write the intended rule down before comparing results.
A falling CHOP line also does not mean falling price. For a related example of separating strength from direction, see why ADX can rise in a downtrend. The two indicators use different calculations; their readings are not interchangeable.
Make the filter testable before routing an alert
Specify the symbol, timeframe, length, threshold and decision time. Then define the directional entry separately, such as a close above a previously established breakout level. State whether the filter only controls new entries or can also trigger exits. Otherwise, a later rise in CHOP can quietly become an exit rule you never intended.
For an initial comparison, keep the entry logic, position sizing, exits and cost assumptions unchanged. Compare that baseline with one CHOP filter. Record which trades were removed, how many remain and how the remaining outcomes differ. Fewer losing trades alone is insufficient if the same filter removes most of the gains. No performance improvement is assumed here.
Changing length changes the observations inside both sides of the ratio and its logarithmic normalization. Do not assume that a threshold chosen for one length or timeframe has the same practical effect elsewhere. Keep the display offset at zero while checking signal alignment; TradingView's Offset setting moves the plotted series relative to the bars.
The final question is concrete: on this bar, did the directional setup occur, and did the filter permit it? If those answers cannot be reconstructed from the saved settings and chart data, the alert rule is not yet ready to automate.