AlgoWay Blog
Guides, manuals and platform references.
Core
- All articles
- FAQ
- PineConnector alternative
- TradersPost alternative
- Automate TradingView alerts
- Automate Telegram signals
- AlgoWay CopyTrader
- cTrader Copier
- TrendSpider with AlgoWay
- How to Automate a TradingView Indicator with Dynamic SL/TP and 1% Risk on MT5
JSON & Alerts
- JSON schema
- Manual alerts
- TradingView without paid subscription
- AlgoWay Strategy Integration in Pine Script
- Python Trading Bot Webhook Integration
- TRALADAL - TradingView Alert Adapter
- TradingView Order Action Alert
- How to use Clone Mode
MT5 / Expert Advisors
Errors
Integrations
- MetaTrader 5
- Tradovate
- TradeLocker
- cTrader
- Match-Trader
- DXtrade
- Capital.Com
- Binance
- Bybit
- MEXC
- OKX
- Bitget
- Hyperliquid
- BingX
- Alpaca
- Interactive Brokers
- Gate.io
- Coinbase
- TooBit
- WEEX
- KuCoin
- Kraken
- ProjectX
- Rithmic
Other Publications
- MT5 EA Webhook JSON Reference
- OANDA MT5 with AlgoWay
- Buy Webhook via Buy Me a Coffee
- AlgoWay vs PineConnector
- Compare AlgoWay with other trading automation tools
- AlgoWay Red News Filter
- Why Paid Trading Indicators Avoid Verifiable Backtests
- How Trade Automation Tools Mislead You
- utomating a Prop-Firm Eval End to End:
- ATP Premium Indicator Testing Bot
- Why TradingView Backtests Win but Live Trades Lose
- Best Prop Firms for Trading Automation and Telegram Signal Copy in 2026
- Four AIs, One Trader, and the Strange Case of TradingView to Alpaca
- TradingView Automation
AlgoWay Strategy Lab
Bollinger %B vs BandWidth: Price Location or Volatility?
Published November 13, 2026
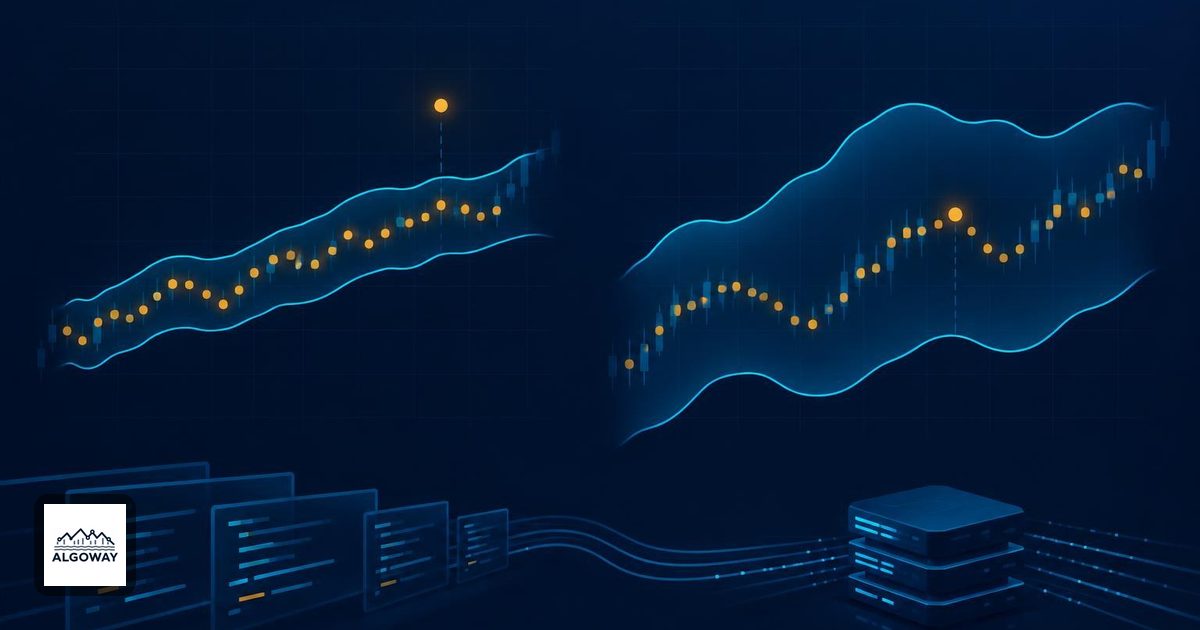
A close above the upper Bollinger Band and a low BandWidth reading can coexist. One measures where price sits within an envelope; the other measures the envelope's width relative to its middle. A narrow doorway still has an outside.
%B measures price location. BandWidth measures relative band separation. In TradingView automation, confusing the two changes the condition that sends an alert. Before connecting a rule through AlgoWay's TradingView alert workflow, specify whether the event is a price crossing, a volatility filter, or both.
Two calculations, two denominators
Let U be the upper band, L the lower band, M the middle band and P the selected price. TradingView's %b reference defines the location measure as:
%B = (P - L) / (U - L)
On this scale, 0 means the lower band, 0.5 the midpoint and 1 the upper band. Values above 1 or below 0 are valid: price is outside the envelope. A value of 1.2 does not mean a 120% price gain.
TradingView's BandWidth reference uses a different calculation:
BandWidth = (U - L) / M * 100
Its percentage denominator is the middle band, not the distance between the bands. Check the plotted scale in any other implementation before transferring thresholds: a fractional width of 0.02 and a percentage width of 2 describe the same separation.
A close outside narrow bands
Consider these hypothetical snapshots. The band levels are supplied for arithmetic illustration, not taken from a market test. Each snapshot uses symmetric bands around 100.
| Snapshot | Lower | Middle | Upper | Price | %B | BandWidth |
|---|---|---|---|---|---|---|
| A | 99 | 100 | 101 | 101.20 | 1.10 | 2% |
| B | 95 | 100 | 105 | 104 | 0.90 | 10% |
| C | 99 | 100 | 101 | 98.80 | -0.10 | 2% |
In A, the location calculation is (101.20 - 99) / 2 = 1.10. Width is 2 / 100 * 100 = 2%. Price is outside, although the envelope spans only 2% of its middle value. In B, the bands are five times as wide, yet price remains inside. C has the same width as A but price is below the lower band. Width alone cannot distinguish their directions.
These are separate snapshots, not a claim that bands stay fixed while price moves. In a live calculation, the latest input can change the mean and standard deviation as well as the price-location numerator. Always compare values from the same bar and settings.
Do not turn location into a reversal promise
John Bollinger's published rules caution that a band touch alone is not a buy or sell signal and that trends can follow a band. Thus %B above 1 describes an observation, not a command to sell.
Likewise, calling 2% width “low” requires context. Compare the instrument and timeframe with their own history rather than applying one universal cutoff. For the separate question of whether compression predicts the next direction, see what a Bollinger squeeze can and cannot tell you.
Write the event before building the alert
Suppose a research rule requires the previous completed bar's width to be below a chosen threshold, followed by %B crossing above 1 on the current completed bar. That is different from requiring narrow width on the breakout bar itself. Expansion during the breakout could make the second rule reject an event the first accepts.
Also distinguish “%B is above 1” from “%B has crossed above 1.” The first condition can remain true for several bars. The second compares the current reading with the previous reading and identifies a transition. Neither statement specifies trade size, exit rules or whether another entry is allowed while already in a position.
Record the source price, length, deviation multiplier, timeframe, threshold scale and bar-confirmation policy together. If the band spread is zero, %B has no defined denominator; if the middle is zero, the width formula is undefined. An automated rule should skip undefined measurements rather than silently treat them as zero. Test the resulting events and costs before assigning them execution instructions. A precise indicator reading is useful evidence about price geometry, not evidence of profitability.