AlgoWay Blog
Guides, manuals and platform references.
Core
- All articles
- FAQ
- PineConnector alternative
- TradersPost alternative
- Automate TradingView alerts
- Automate Telegram signals
- AlgoWay CopyTrader
- cTrader Copier
- TrendSpider with AlgoWay
- How to Automate a TradingView Indicator with Dynamic SL/TP and 1% Risk on MT5
JSON & Alerts
- JSON schema
- Manual alerts
- TradingView without paid subscription
- AlgoWay Strategy Integration in Pine Script
- Python Trading Bot Webhook Integration
- TRALADAL - TradingView Alert Adapter
- TradingView Order Action Alert
- How to use Clone Mode
MT5 / Expert Advisors
Errors
Integrations
- MetaTrader 5
- Tradovate
- TradeLocker
- cTrader
- Match-Trader
- DXtrade
- Capital.Com
- Binance
- Bybit
- MEXC
- OKX
- Bitget
- Hyperliquid
- BingX
- Alpaca
- Interactive Brokers
- Gate.io
- Coinbase
- TooBit
- WEEX
- KuCoin
- Kraken
- ProjectX
- Rithmic
Other Publications
- MT5 EA Webhook JSON Reference
- OANDA MT5 with AlgoWay
- Buy Webhook via Buy Me a Coffee
- AlgoWay vs PineConnector
- Compare AlgoWay with other trading automation tools
- AlgoWay Red News Filter
- Why Paid Trading Indicators Avoid Verifiable Backtests
- How Trade Automation Tools Mislead You
- utomating a Prop-Firm Eval End to End:
- ATP Premium Indicator Testing Bot
- Why TradingView Backtests Win but Live Trades Lose
- Best Prop Firms for Trading Automation and Telegram Signal Copy in 2026
- Four AIs, One Trader, and the Strange Case of TradingView to Alpaca
- TradingView Automation
AlgoWay Strategy Lab
Aroon Indicator: Time Since Highs and Lows Explained
Published: October 19, 2026 · AlgoWay
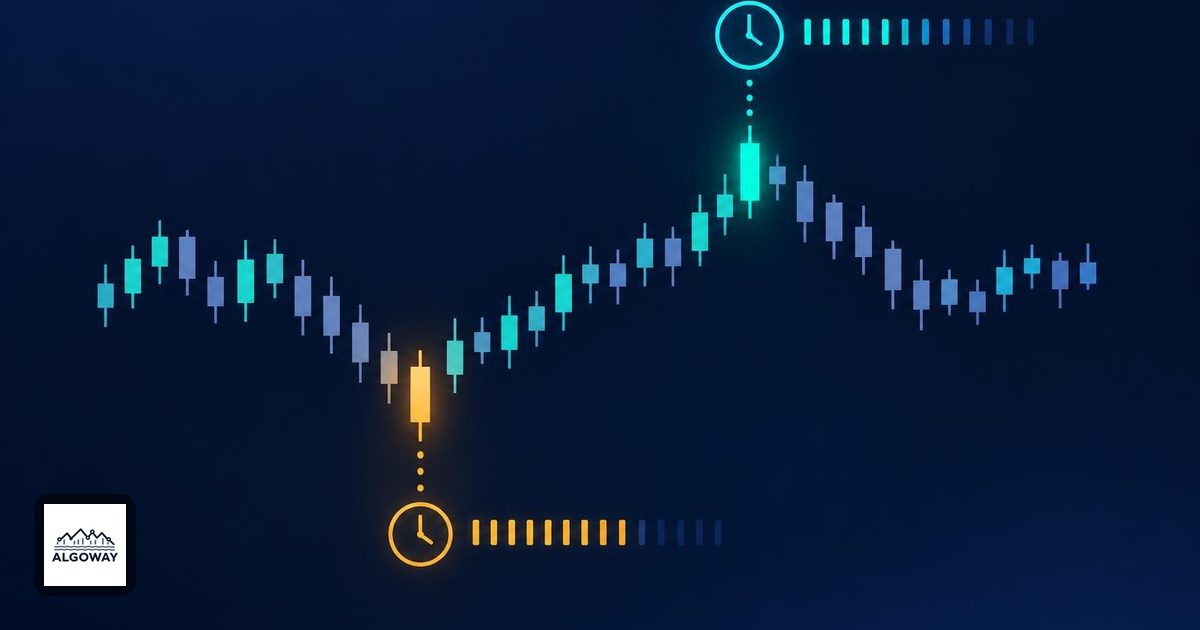
Aroon can reach 100 after a modest new high. That does not mean price rose 100%, or that the next trade has a 100% chance of winning. The number describes how recently an extreme occurred within a chosen window.
For TradingView automation, this matters before an indicator condition becomes an execution instruction. A recent high, a line crossover and a large price move are different events. When reviewing an AlgoWay workflow, use the AlgoWay guide to trend strength versus direction alongside this one: first name what the indicator measures, then decide what event deserves an order.
Count bars since the extreme
Aroon has two lines. Up tracks the age of the highest high; Down tracks the age of the lowest low. With length N and an extreme k bars ago, the calculation is 100 × (N − k) / N. TradingView gives a 14-period example in its Aroon indicator reference.
Using N = 14, the following are illustrative inputs to that formula. They are not observations from a market test.
| Age of the relevant extreme | Calculation | Aroon value |
|---|---|---|
| Current bar: 0 bars ago | 100 × 14 / 14 | 100 |
| 2 bars ago | 100 × 12 / 14 | 85.71 |
| 7 bars ago | 100 × 7 / 14 | 50 |
| 12 bars ago | 100 × 2 / 14 | 14.29 |
If the highest high was two bars ago and the lowest low twelve bars ago, Up is about 85.71 and Down about 14.29. The difference is about 71.43. The high is more recent; the formula has not told you how far price traveled between those extremes.
Why the price distance is missing
Consider two invented price paths whose highest highs both occurred two bars ago. One high exceeds the preceding peak by a tiny price increment; the other exceeds it by a large gap. Provided the extreme ages and length match, their Aroon Up values match. The formula contains age and length, not the difference between prices.
The same reasoning explains a declining Up line. While the same high remains in the window and no newer equal or higher high replaces it, its age increases. Price need not fall on every intervening bar. A sequence of higher closes can still remain below that earlier high.
Before comparing chart readings, match the symbol, candle timeframe, length and indicator implementation. A fourteen-bar window on a five-minute chart and one on a daily chart describe different stretches of market activity.
Do not confuse the two lines with the oscillator
The Aroon Oscillator subtracts Down from Up and ranges from −100 to +100. A positive result means the high is more recent than the low; it is not a percentage return. TradingView's oscillator documentation also specifies that its extreme-search window contains one more bar than the Length input. This detail matters when reproducing values in another script.
For example, Up = 90 and Down = 80 produces an oscillator of 10. So does Up = 30 and Down = 20. The difference is identical, but the two pairs describe different ages. Keep both lines visible when your proposed rule depends on whether either extreme is very recent.
Write the event before building the alert
Here is a research rule, not a recommended strategy: on a completed chart bar, flag a bullish condition when Up crosses from at or below Down to above Down, with Up also above 70. The extra threshold is an arbitrary hypothesis to test. It is not part of the Aroon formula.
That rule differs from “Up is above Down.” The latter can remain true for many bars. Decide separately whether an existing position permits another entry, what closes the trade, and how much can be lost. An indicator line supplies none of those account-management decisions.
For a Pine script using alert(), TradingView documents alert.freq_once_per_bar_close as triggering only when the realtime bar closes and the call executes on that update. See the Pine alert-frequency documentation. The rule and its evaluation timing should agree.
When checking one signal, record the bar timestamp, both extreme ages, both Aroon values and the condition that changed. That small record answers a better question than “Did the line look bullish?” It tells you exactly why the automation was asked to act.